Lymphocyte cytosolic protein 1 (LCP1) is a novel TRAF3 dysregulation biomarker with potential prognostic value in multiple myeloma
Original Research Paper
Eun Myoung Shin, Sultan Abda Neja, Kerem Fidan, Joelle Yi Heng Chua, Tae-Hoon Chung, Nicolas Bertin, Vinay Tergaonkar, Wee-Joo Chng & Melissa Gaik-Ming Ooi
Genome Instability & Disease 1,286–299(2020)
Abstract
Chromosomal rearrangement involving 14q32 region that results in TNF receptor associated factor 3 (TRAF3) dysfunctional mutation is the most frequent NF-κB pathway mutation in multiple myeloma (MM). Subsequent NF-κB inducing Kinase (NIK) stabilization plays a critical role in alternative NF-κB activation. However, disease progression resulting from TRAF3 dysregulation has not been well understood. In this study, we identified lymphocyte cellular protein 1 (LCP1) as a novel NIK-driven alternative NF-κB target in TRAF3 dysfunctional mutation using RNA-seq, ChIP-seq (RelA/p65 and p52 NF-κB) and other validation methods. LCP1 is exclusively activated in MM cells with TRAF3 loss-of-function mutation. In MM patients, higher LCP1 expression was significantly pronounced in poor prognosis groups such as 4p16 and MAF. CD138 negative MM patient cells showed elevated LCP1 expression and inhibition of LCP1 can sensitize proteasome inhibitor bortezomib in TRAF3 mutant MM cells in vitro. We report that LCP1 is a NIK-driven biomarker in TRAF3 dysfunctional MM and targeting LCP1 can provide a valuable therapeutic intervention in TRAF3 mutated MM.
Introduction
Multiple myeloma (MM) is a malignancy of the antibody-producing plasma cells that accumulate in the bone marrow. It is the 2nd most common hematopoietic malignancy, comprising approximately 1% of all cancers, 10% of hematopoietic malignancies, and 2% of cancer-related deaths (Stuhmer et al. (2005); (Yuregir et al. 2009). In MM, abnormal nuclear factor κB (NF-κB) pathway activation is the most common feature, making up 17% of MM cases and 40% of MM cell lines (Annunziata et al. 2007; Lohr et al. 2014; Keats et al. 2007). These studies found amplification or rearrangement of genes including NIK, LTBR, TACI, NFΚB1, NFΚB2, and CD40, as well as deletion or loss-of-function mutations in genes including CYLD, BIRC2/BIRC3 (cIAP1/cIAP2), TRAF2, and TRAF3, each of which results in the activation of NF-κB associated gene activation. Although several studies indicated that activation of both canonical and non-canonical NF-κB pathways are involved in the pathogenesis of MM, disease progression that stem from the activation of the non-canonical NF-κB pathway has not been clearly understood.
NF-κB family consists of five transcription factors, RelA, RelB, c-Rel, NFKB2 and NFKB1 that play key roles in the innate and adaptive immunity, regulation of cell growth, development, proliferation, survival, and death (Hayden and Ghosh 2008; Vallabhapurapu and Karin 2009; Chew et al. 2018; Puar et al. 2018). There are two distinct NF-κB signaling pathways. The canonical NF-κB signaling is to activate through TNF receptor families such as Toll-like receptor (TLR) family (Hacker et al. 2006; Oganesyan et al. 2006), interleukin-1 receptor (IL-1R) family (Medzhitov 2008) and cytoplasmic RIG-I-like receptor (RLR) family (Takeuchi and Akira 2010) to initiate target gene transcription for innate immune responses (Hacker et al. 2011) and hematopoiesis (Khattar et al. 2019; Wang et al. 2015). The non-canonical NF-κB pathway, on the other way, is activated by NF-κB-inducing kinase (NIK) to regulate B cell development, survival, and secondary lymphoid organogenesis (Cildir et al. 2013; Sun 2011). Recent studies have identified NIK-dependent TERT promoter reactivation in solid tumors (Xu et al. 2018; Li et al. 2016; Ozturk et al. 2017; Akincilar et al. 2015; Khattar et al. 2016). The non-canonical NF-κB pathway is controlled by the processing of the inactive NF-κB2 (p100) to the active p52 isoform. The control of this process is dependent upon the activation of NIK, a protein kinase whose levels are kept low by co-translational degradation in a TNF-receptor-associated factor 3 (TRAF3)-dependent manner. Of all TRAFs, TRAF3 plays a unique role as a negative regulator in the non-canonical NF-κB pathway, mediating a subset of TNFRs signaling (), including B-cell activating factor receptor (BAFF) (Claudio et al. 2002), lymphotoxin-β-receptor (LTβR) and CD40 to induce immune responses and B-cell survival (Vallabhapurapu and Karin 2009). TRAF3 is constitutively bound to NIK in un-stimulated cells (Xiao et al. 2001a) and the interaction of TRAF3 with TRAF2 recruits E3 ligase cIAP1/2 complex to NIK, leading to the K48 ubiquitylation-mediated degradation of NIK. This keeps cellular NIK levels low, preventing uncontrollable NIK-driven proliferation of B lymphocytes. A recent study of 203 MM patients in tumor-normal pairs revealed that TRAF3 mutations are the single most common abnormality in NF-κB signaling in MM pathogenesis, comprising 5% of MM cases (Keats et al. 2007; Lohr et al. 2014). In MM, high-risk groups with poor prognosis are frequently associated with loss-of-function of TRAF3 due to genetic rearrangements such as mono- or bi-allelic deletion (Ooi et al. 2016). However, the molecular effectors of TRAF3 loss-of-function mutations that can regulate proteasome inhibitor action have not been identified.
In our preliminary study, we found that MM cells with TRAF3 mutations are less sensitive to proteasome inhibitors. Through genome-wide chromatin immunoprecipitation sequencing (RelA and p52 NF-κB ChIP-seq analysis) and RNA-seq analysis, we discovered that LCP1 is highly activated in mutant TRAF3 MM cells exclusively and more importantly, LCP1 activation is dependent on NIK activity. Additionally, LCP1 expression is pronounced in poor prognosis groups such as 14p6 and MAF (MM TC classes). Furthermore, both NIK and LCP1 are negatively correlated with CD138 positivity in MM patient samples. We know from AML patient data that high expression levels of NIK and LCP1 are associated with poor patient survival. Therefore, in this paper, we present LCP1 as a biomarker for TRAF3 dysregulation. Characterization of the mechanism of action of LCP1 on bortezomib treatment can provide a novel therapeutic strategy for MM patients with TRAF3 dysregulation.
Results
TRAF3 dysregulation constitutively activates non-canonical NF-κB pathway in MM cells
The C-terminal MATH/TRAF domain of TRAF3 is known to interact with NIK and TRAF2. A graphic model of this negative regulation of TRAF3 complex suppressing NIK and alternative NF-κB activation is shown in Fig. 1a. Simplified functional domains of TRAF3 and brief TRAF3 mutation information of MM cell lines used in this study are presented in Fig. 1b. First, MM cell lines that have previously been identified to be TRAF3 wild-type (WT) or mutant were subject to EMSA to validate the constitutive NF-κB activation status in mutant cell lines (Fig. 1c, upper panel). Strong NF-κB complex binding to consensus motif in TRAF3- or NIK-mutant MM cell lines was compared to the low NF-κB binding activity in WT cell lines, indicating constitutive NF-κB activation in mutant cell lines. Transcription factor AP-1 in MAPK signaling was tested as a control and showed little difference among tested cell lines (Fig. 1c, lower panel). Interestingly, KMS11 mutant cells showed little difference to immune response stimuli such as TNFα and LTβR, indicating NF-κB activation saturation in mutant cells. Wild type XG7 cells; however, showed expected induced responses to stimuli given (Supplementary Fig. 1a). NFKBIA and TNFα mRNA expressions in mutant cells also showed little changes by TNFα or LTβR (Supplementary Fig. 1b, c). Next, we fractionated nucleic proteins to check NF-κB subunits translocation activity, western blot analysis demonstrated that RelB and p52 were the major NF-κB subunits in the nucleus of TRAF3 or NIK mutant MM cell lines, while p65 nuclear translocation showed little difference across all cell lines tested (Fig. 1d). Interestingly, nuclear translocation of p50 was also pronounced (data not shown). Next, we conducted EMSA super-shift assay to identify key NF-κB subunits in the binding complex. RelB, p52 and p50 subunits were shown as major subunits in mutant KMS11 and MM1.S cells with clear exclusion of canonical NF-κB subunits p65 and c-Rel, further proving non-canonical NF-κB activation dependency in TRAF3-mutant MM cells (Fig. 1e). In contrast to these, wild type XG7 cells showed classical NF-κB pathway activation paradigm with the formation of p65; p50 heterodimer in TNFα-induced, and RelB; p52 in LTβR-induced conditions, respectively (Fig. 1f). Figure 1g demonstrates induction of NF-κB activation in these conditions.
Fig. 1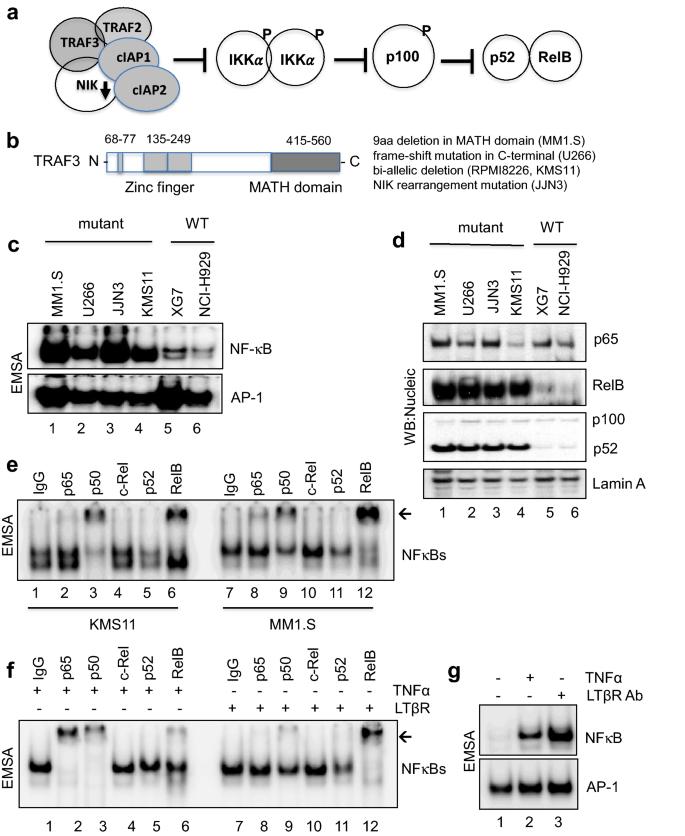
TRAF3 mutation constitutively activates alternative NF-κB pathway in mutant MM cells. a Schematic model of NIK-dependent alternative NF-κB activation. b Simplified functional domains of TRAF3, MATH: merpin and TRAF homology. c NF-κB and AP-1 DNA binding assay as described in Methods. Un-stimulated mutant (MM1.S, U266, JJN3 and KMS11), wild type (XG7 and NCI-H929) cells were tested in EMSA. d Western blot images of nucleic protein lysates as shown in (c). e EMSA super-shift images of KMS11 and MM1.S nucleic proteins are presented with indicated antibodies tested. Normal Rabbit IgG was used as control. f Wild type XG7 cells were treated with human recombinant TNFα or LTβR for super-shift assay. A representative image of super-shift was shown with used antibodies indicated. g Induced NF-κB activation by TNFα or LTβR treatment in XG7 cells was shown with AP-1 transcription factor EMSA for control for non-inducible activation
Full size imageTRAF3 loss-of-function executes genome-wide NF-κB activation in MM cells
To understand how TRAF3 loss-of-function can direct abnormal NF-κB transcriptional activity in genomic scale, we next carried out ChIP-seq analysis, namely p65 ChIP-seq for canonical and p52 ChIP-seq for non-canonical NF-κB pathway activation, respectively, using mutant (MM1.S, U266, RPMI8226 and JJN3) and wild type (XG7 and KMS28BM) MM cell lines. As expected, ChIP-seq data analysis showed significant NF-κB enrichment in mutant cells compared to wild type. Interestingly, in all tested MM cell lines, there were greater p65 complex chromatin binding events than that of p52 (Supplementary Fig. 2a). The majority of enrichment occurs in gene-associated regions (Supplementary Fig. 2b), suggesting elevated transcriptional activities of p65 and p52 on the associated genes. We also observed from MM1.S ChIP-seq data that enrichment patterns of p65 and p52 to all of NF-κB promoter regions were very similar, suggesting that both p65 and p52 can regulate all five NF-κB subunits in a constitutive manner when TRAF3 is dysfunctional (Supplementary Fig. 2c). Well known NF-κB target genes such as NFKBIA and TNFAIP3 also showed comparable p65 and p52 binding to regulatory regions (Supplementary Fig. 2d). We also identified p52 exclusive binding enrichments on CD70, JSRP1, CD83, CDCA7L, and IL32, limited to TRAF3 mutant cells (MM1.S) (Supplementary Fig. 2e). Using ChIP-seq analysis, similar binding patterns of p65 and p52 to their target genes have also been reported in all five members of NF-κB using LMP1 (a CD40 mimic) constitutive activation, in GM12878 (a lymphoblastoid B cell line) (Zhao et al. 2014). These elevated binding events by all NF-κB members in the genomic scale indicate MM cells’ dependence on NF-κB activity for survival, where proteasome-dependent pathway activation is a key mechanism, further explaining why MM cells are sensitive to proteasome inhibitor treatments.
We next examined transcriptomes in our RNA-seq data identifying 1133 significantly up-regulated genes and 1168 down-regulated genes in TRAF3 mutant cell lines (Fig. 2a). We further narrowed down the genes for validation study by selecting the top 20 up- and down-regulated genes in all mutant TRAF3 cell lines tested (total 40 genes). We identified LCP1 as one of the most differentially up-regulated genes in all TRAF3 mutant cell lines (Fig. 2b) with the highest significance (log2-FC = 7.12 and p-val = 6.45E-11) (Fig. 2c).
Fig. 2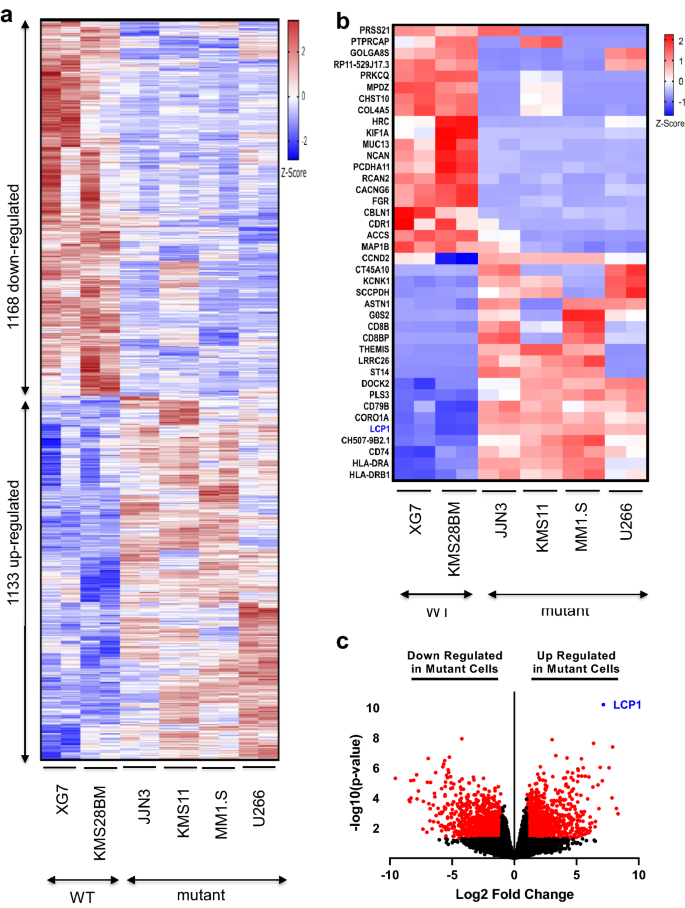
RNA-seq analysis uncovered potential NF-κB2 targets in TRAF3 mutant MM cells. a A heat-map based on RNA-seq data is presented with differentially expressed genes in mutant and wild type cell lines as indicated (RNA-seq n = 2). b Top 20 up- and down-regulated (total 40 genes) based on fold change (with p value < 0.05) from the differentially expressed genes in mutant and wild type cell lines are presented with LCP1 highlighted (blue). c Volcano plot shows significantly and differentially expressed genes in red dots. LCP1 is highlighted as one of the top differentially expressed gene with lowest p value
Full size imagePotential NF-κB2 targets are revealed from the calcium binding gene group
Furthermore, Gene Ontology analysis revealed that genes coding for calcium binding proteins were one of the most differentially expressed functional gene groups in TRAF3 mutant cell lines (Fig. 3a). Simplified functional domains of LCP1 with calcium binding domains are presented in Fig. 3b. For validation of our RNA-seq, we also checked protein expression levels of LCP1 in mutant and wild type MM cells. As expected, LCP1 is exclusively and highly expressed in TRAF3 or NIK mutant cells (Fig. 3c). All calcium binding protein coding genes that are differentially expressed in WT and mutant cells were shown with LCP1 highlighted (Fig. 3d).
Fig. 3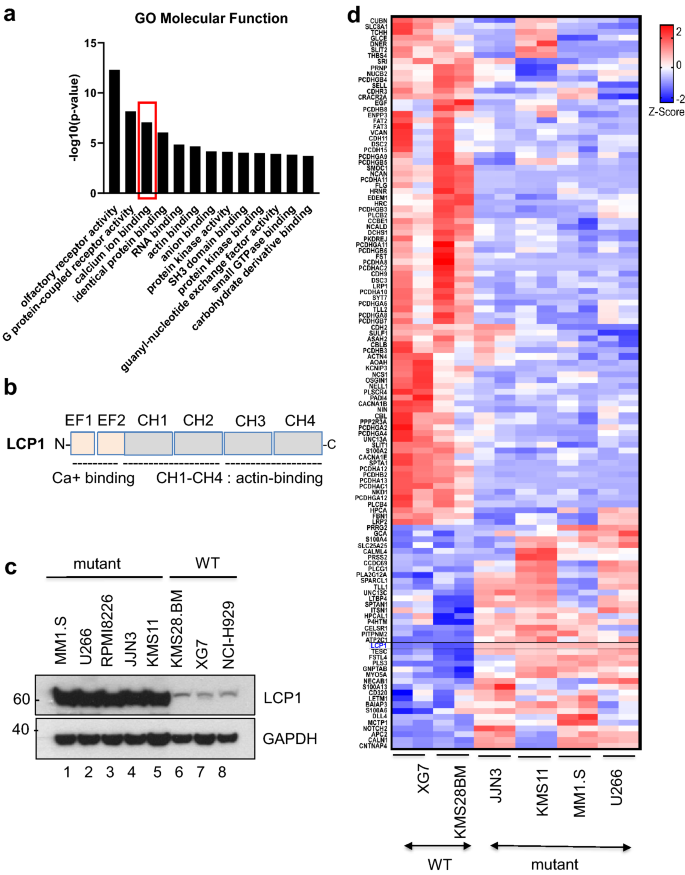
TRAF3 functional loss disrupts calcium ion binding genes transcriptions. a Gene ontology analysis is presented with top molecular functional group of differentially expressed genes. Calcium ion binding gene group is one the most significant based on GO term and highlighted in a box (red). b Simplified functional domains of LCP1 with calcium binding motifs are shown. EF: EF-hand, CH: Calponin Homology. c Western blot image of basal protein expressions of LCP1 in MM cell lines as indicated. d A Heatmap illustrates all differentially regulated genes in calcium ion binding in GO term as MM cell lines as indicated
Full size imageLCP1 hyper-activation in TRAF3 mutant cells is NIK-dependent and promotes survival
Next, we asked if these up-regulated calcium binding genes in TRAF3 mutant cells are NIK-activation dependent. To answer that, we generated NIK over-expressing XG7 cells as described. We observed the up-regulation of LCP1, PLEK, RASEF, and MCTP1 mRNA expression in NIK over-expressing XG7 cells (Fig. 4a–e), indicating that their transcriptions can be NIK-dependent. Next, we examined LCP1 mRNA levels with NIK knockdown in mutant MM1.S and KMS11 cells and showed that shNIK can down-regulate LCP1 mRNA levels in mutant cells (Fig. 4f–g). To further understand the role of LCP1 in TRAF3 mutant cells, lentiviral shLCP1 knockdown stable clones were generated in MM1.S cells. LCP1 depletion showed a significant decrease in colony formation, suggesting that LCP1 is essential for cell proliferation in TRAF3-mutant MM1.S (Fig. 4h, i). As TRAF3 mutant cells are sensitized to proteasome inhibition due to genome-wide NF-κB activation (as shown above), we were able to demonstrate increased sensitivity to bortezomib, where LCP1 knockdown showed decreased viability to bortezomib exposure (Fig. 4j).
Fig. 4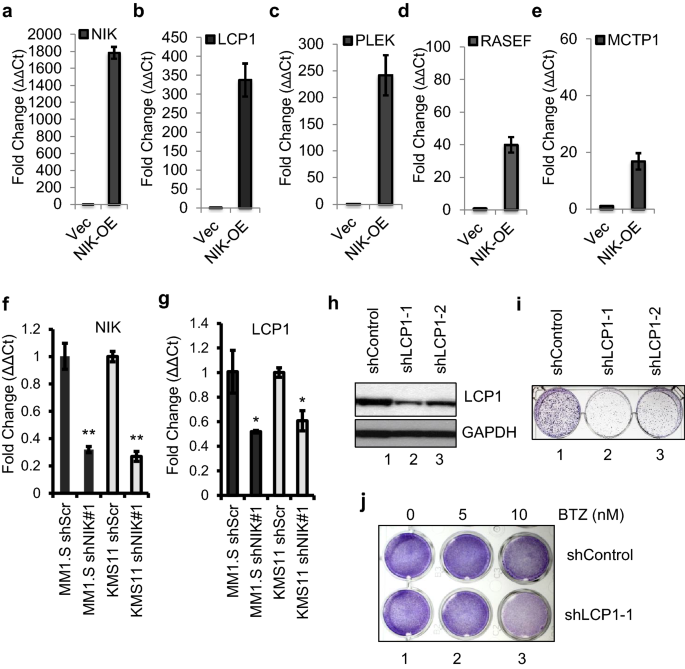
NIK-dependent LCP1 activation is essential for TRAF3 mutant MM cell proliferation. a-e NIK-overexpressing XG7 cells were generated as described in Methods and tested for transcriptional changes of selected calcium ion binding protein coding genes LCP1 (b), PLEK (c), RASEF (d) and MCTP1 (e). Empty vector infected XG7 cells were used as control. f Knockdown of NIK in MM1.S and KMS11 cells were shown. g LCP1 mRNA expressions with NIK knockdown in MM1.S and KMS11 cells were shown. h LCP1 protein knockdown levels by two different short hairpin constructs are shown (as control in i, j). i A representative colony forming assay conducted in MM1.S cells as indicated. j Cell viability tested with LCP1 knockdown with bortezomib (BTZ) was presented with Crystal violet staining
Full size imageLCP1 is a bona fide NF-κB2 target gene
To further validate LCP1 as a novel NF-κB2 target, binding regulatory motifs of five transcription factors on the LCP1 promoter region (between − 2000 bp and − 100 bp from TSS) were tested in EMSA using NIK-over-expressing XG7 (Fig. 5a). With the clear exclusion of GFI1 (Growth factor independent 1), ETS1 or GABPA binding to their motifs, only NF-κB binding to LCP1 promoter was induced with NIK activation. Western blot analysis of the protein expression in NIK-overexpressing XG7 cells further demonstrated processed p52 increase correlation with LCP1 expression (Fig. 5b). We also performed EMSA analysis to examine transcriptional activity on the LCP1 promoter region of mutant KMS11 and found exclusive NF-κB binding activity, in contrast to the little or no activity of other TFs site in LCP1 promoter, supporting our findings (Fig. 5c). We also looked into the regulatory region NF-κB binding events in our ChIP-seq data and found that NF-κB p52 and p65 enrichment on the promoter region of LCP1 are higher in mutant cells than wild type (Fig. 5d).
Fig. 5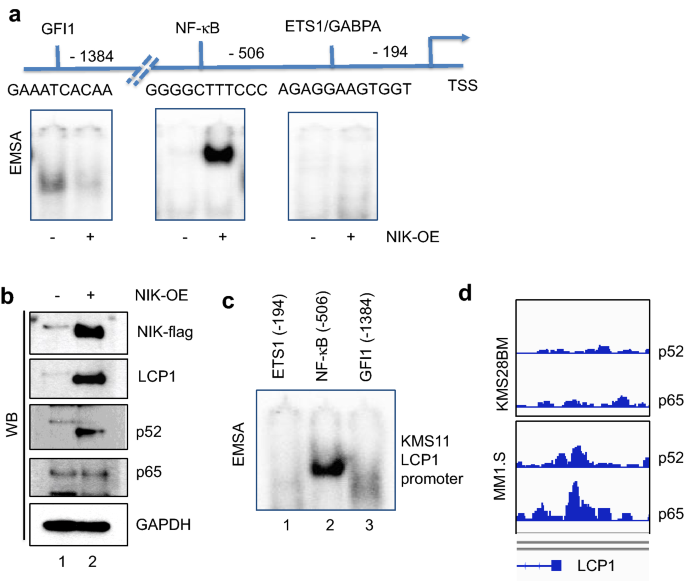
LCP1 is a NIK-dependent NF-κB2 target. a A representative EMSA images showing DNA binding activities of indicated transcription factors in LCP1 promoter using NIK-overexpressing XG7 cells lysates are presented. b Western blot images of NIK-overexpressing XG7 cells lysates with antibodies indicated. c LCP1 promoter region of mutant KMS11 was tested in EMSA with labelled probes for indicated transcription factor binding activities as shown in a, d ChIP-seq enrichment image on LCP1 promoter regions in KMS28BM (WT) and MM1.S (mutant) were shown
Full size imageLCP1 expression is highly pronounced in poor prognosis disease groups
Next, we went on to explore the clinical significance of LCP1 in MM patients. In MAYO and UMAS datasets, we found that MAP3K14 was correlated with MAF TC class (Fig. 6a, b) and LCP1 expression is highly correlated with 4p16 and MAF TC class known to be of poor prognosis (Fig. 6c, d). Considering NIK is a kinase that modulates protein modifications in the pathway, we speculated that LCP1 transcripts are a potential biomarker for 4p16 and MAF subgroup of MM associated NIK-activation.
Fig. 6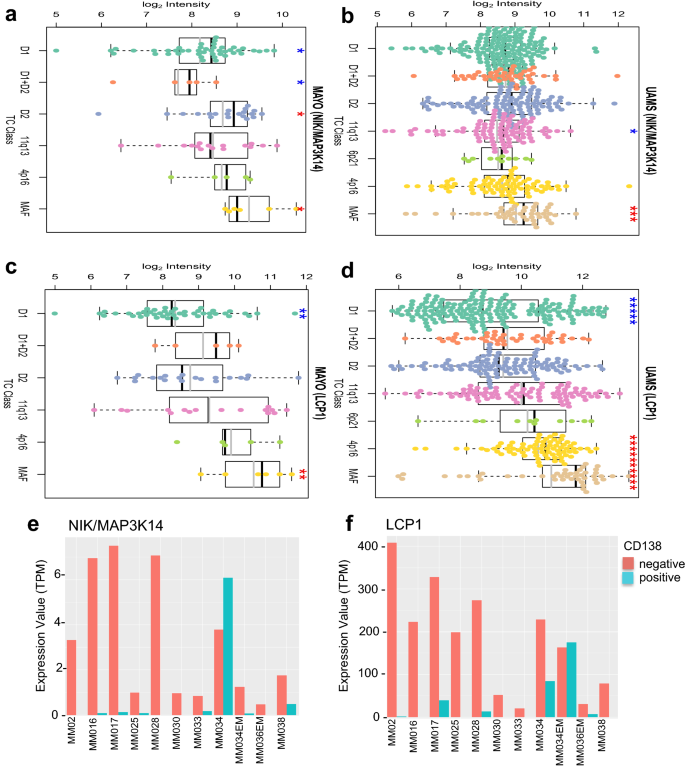
MAP3K14 and LCP1 are highly expressed in poor prognosis group in MM patients. a–b MAP3K14 mRNA expressions in different MM patient TC classes were plotted, in MAYO (a) and UMAS data set (b). c-d Same patient TC classes were plotted for LCP1 mRNA expression in MAYO (c) and UMAS (d) data set, respectively, as described in Methods. For UMAS (LCP1), p = 3.36e-15 (4p16 vs. D1) and p = 3.28e-08 (MAF vs. D1), respectively. e–f GSE106218 RNA-seq data set were examined for CD138 positivity in patient-derived MM cells. MAP3K14 (e) and LCP1 (f) mRNA levels of indicated with patient ID
Full size imageIntriguingly, we found that NIK (Fig. 6e) and LCP1 (Fig. 6f) expression in MM patients are negatively correlated with MM cell marker CD138 (Ryu et al. 2020). It has been reported that a significant decrease of CD138 level in relapsed patients is associated with poor overall survival (Kawano et al. 2012; Tang et al. 2017). There is little published on LCP1 associated survival data in MM; however, in AML, NIK and LCP1 expression are shown to adversely affect patient overall survival (Supplementary Fig. 3a, b). Tumor normal matched expression also showed a significant increase of LCP1 level in AML patients (Supplementary Fig. 3c). MAP3K14 expression also showed a similar result with no statistical significance (Supplementary Fig. 3d).
To further demonstrate that LCP1 is a poor prognostic factor, we generated survival plots for LCP1 using the NCI Genomic Data Commons (GDC) (Grossman et al. 2016) under the MMRF-CoMMpass project (Manojlovic et al. 2017) using TCGA biolinks (Colaprico et al. 2016). From the survival plots, high levels of LCP1 was associated with a poor prognosis MM phenotype, similar to other known high-risk mutations such as KRAS and NRAS. This phenomenon was reversed for ATM in which low expression levels were associated with poor prognosis and expression level of ATR and BRAF did not demonstrate any prognostic power (Fig. 7).
Fig. 7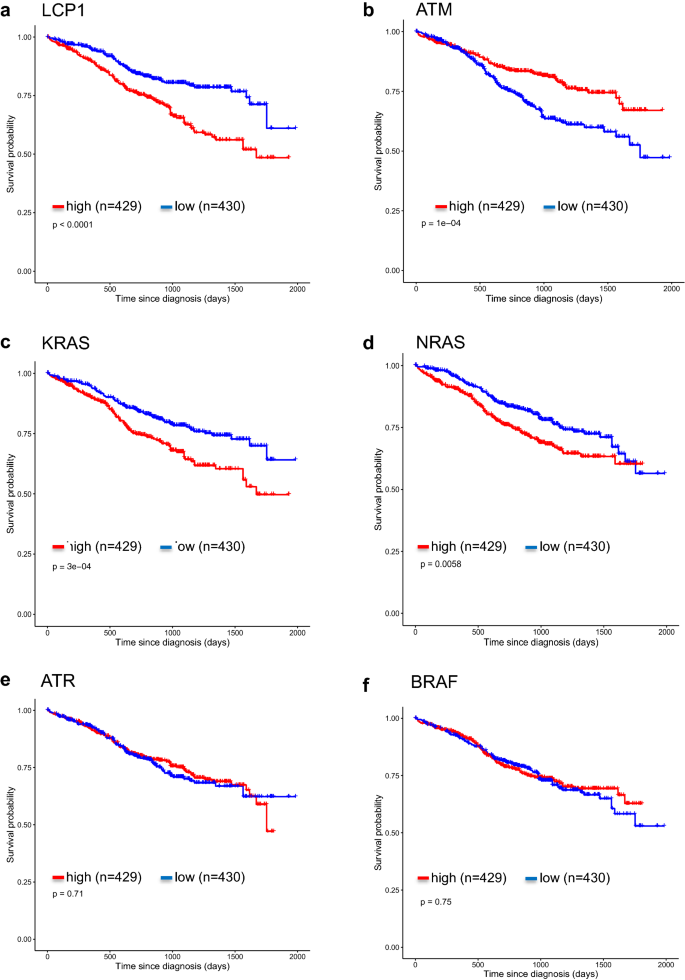
Kaplan–Meier curves generated for indicated genes. a–f Survival plot for low and high expression levels for individual genes using data obtained from NCI Genomic Data Commons (GDC) under MMRF-CoMMpass project using TCGA biolinks
Full size imageDiscussion
Non-redundant functions of TRAF3 from other TRAFs are essential for survival in mammals. In mice, homozygous deletion of TRAF3(-/-) causes death on day 10 after birth with severe progressive runting and massive loss of splenic cellularity (Xu et al. 1996). TRAF3 conditional knockout in B lymphocytes causes B lymphoma in mice (Xie et al. 2007) and chromosomal rearrangements involving 14q32 such as in t(14;16)(q32;q23) frequently leads to mono- or bi-allelic deletion of TRAF3 which may cause multiple myeloma (Zarnegar et al. 2008).
As the NF-κB pathway is constitutively activated in MM, the level of pathway activity is best assessed using the NF-κB 10 and NF-κB 3 index. The NF-κB ten index consists of the averaged expression of ten genes; TNFAIP3, NFKB2, IL2RG, NFKBIE, RELB, NFKBIA, CD74, PLEK, MALT1, and WNT10A; whereas the NF-κB three index averages the expressions of TNFAIP3, IL2RG, BIRC3/cIAP2 (Demchenko et al. 2010). The results suggest that for MM patients with a high NF-κB index, an IKK2 inhibitor would be a viable therapeutic agent. Using a similar analysis, the authors also suggested NIK inhibitors for MM treatment for patients demonstrating NIK-dependent NF-κB activation (Demchenko et al. 2014). The attempt to use IKK2 inhibitors (Wen et al. 2006) or NIK inhibitors (Ranuncolo et al. 2012) for MM treatment failed as there were severe side effects limiting their use (Vallabhapurapu and Karin 2009). This is likely as NF-κB activation is important in normal cellular function. Therefore, it is important for this poor prognostic group to discern an alternative target to improve our therapeutic armamentarium. TRAF3 mutation constitutively activates the non-canonical NF-κB pathway in MM cells by enrichment of NF-κB on a genomic scale. From our ChIP-seq data, enrichment patterns suggest that both RelA and p52 can regulate all of the five NF-κB subunits in a constitutive manner when TRAF3 is dysfunctional, leading to elevated binding events by all NF-κB members. This further exposes the MM cells’ dependence on NF-κB activity for survival, where proteasome-dependent pathway activation is a key mechanism, further explaining why MM cells are sensitive to proteasome inhibitor treatments.
In this study, we identified LCP1 as a novel NF-κB target as it was the most differentially up-regulated gene in TRAF3 or NIK mutant MM cell lines. In solid tumors, elevated expression of LCP1 has been reported in breast (Inaguma et al. 2015), colon (Foran et al. 2006; Ning et al. 2014), bladder (Fang et al. 2013), and kidney cancer (Su Kim et al. 2013). Recently, LCP1 is also reported to be critical in the pathogenesis of chronic lymphocytic leukemia (CLL) facilitating microenvironment homing, proliferation and CLL survival (Dubovsky et al. 2013). However, the role of LCP1 in pathogenesis in MM has not been elucidated.
To the best of our knowledge, this is the first report that LCP1 is a bona fide molecular target of NIK-driven non-canonical activation of NF-κB in TRAF3 mutant MM cells. Large datasets in MM patients also demonstrated the correlation of LCP1 expression with poor prognostic markers such as 4p16 and MAF. Independent depletion of LCP1 in TRAF3 mutant MM cells potently decreases cell proliferation and induces susceptibility to proteasome inhibitors to induce cell death. More importantly, this therapeutic potential of LCP1 underlies its strong specific presentations in TRAF3 mutant MM cells, indicating a possible targeted therapy for this MM subtype. Proteasome inhibitors remain the backbone of MM treatment but the response rate is only 25% as a single agent in relapse or refractory MM, demonstrating the strong need for biomarker guided MM treatments.
It is worth investigating if the calcium-binding property of LCP1 can help TRAF3 mutant MM cells sustain in the bone marrow microenvironment, where free cellular calcium level is critical for cell survival. A recent proteo-transcriptomics study conducted in MDA-MB-231, a breast cancer cell line with no tissue specific metastatic potential and its brain metastatic 231-BR demonstrated that 231-BR showed significantly lower expressions in calcium dependent proteins such as transglutaminase/TGM2, S100A4 and LCP1 (Dun et al. 2015), suggesting that brain metastatic 231-BR has minimal dependence on calcium-chelation for survival in the brain. Inversely, LCP1’s calcium binding function may facilitate proliferation of MM cells in the bone. This particular aspect of cancer cells dependent on cellular calcium chelating proteins must be carefully investigated in relevant biological settings to test this hypothesis through further study.
Materials and methods
MM cells and reagents
MM.1S, RPMI8226, U266, KMS11, JJN3, KMS28BM and NCI-H929 human multiple myeloma cells were grown in RPMI-1640 media supplemented with 10% FBS, 2 mM L-glutamine and antibiotics (100 U/mL penicillin and 100 U/mL streptomycin). XG7 cells were grown with additional 2 ng/mL human recombinant IL-6 (R&D Bioscience). TRAF3/NIK mutation status in these cell lines was previously identified and summarized in Fig. 1b (Demchenko et al. 2010). LTβR Ab (R&D Bioscience), and human recombinant TNFα (R&D Bioscience) were reconstituted according to manufacturer’s instructions. Stock solutions of dexamethasone, lenalidomide, bortezomib and carfilzomib were prepared in 100% DMSO.
Immunoblotting and real-time PCR
Western blot analyses were performed following standard protocols, as described previously (Shin et al. 2014). Antibodies used for immunoblots are as follow: anti-RelB (Cell Signaling Technology Cat# 4954, RRID:AB_330626), anti-NIK (Cell Signaling Technology Cat# 4994, RRID:AB_2297422), anti-NFKB2 p100/p52 (Cell Signaling Technology Cat# 4882, RRID:AB_10695537), anti-NF-κB p65 (Santa Cruz Biotechnology Cat# sc-372, RRID:AB_632037), anti-NF-κB p52 (Santa Cruz Biotechnology Cat# sc-298, RRID:AB_2151277), anti-GAPDH (Santa Cruz Biotechnology Cat# sc-32233, RRID:AB_627679), anti-NF-κB p50 (Santa Cruz Biotechnology Cat# sc-7178, RRID:AB_650211), anti-c-Rel (Santa Cruz Biotechnology Cat# sc-70, RRID:AB_2178727), anti-Lamin A (Santa Cruz Biotechnology Cat# sc-20680, RRID:AB_648148) and anti-LCP1 (Santa Cruz Biotechnology Cat# sc-16657, RRID:AB_2136876). For qRT-PCR, total RNA was extracted using TRIZOL reagent (Invitrogen, Carlsbad, CA) and cDNAs were synthesized using Vilo Transcriptase (Invitrogen). qRT-PCR were performed using Sybergreen Master Mix (Bio-Rad) on the CFX96™ Real-Time System (Bio-Rad). Relative expression of genes normalized first to actin (− ΔCt) and (− ΔΔCt) to control cell line (XG7) are presented with SD. Primer oligo sequences for qRT-PCR are MAP3K14 forward 5′- TGC GGA AAG TGG GAG ATC CTG AAT, MAP3K14 reverse 5′- TGT ACT GTT TGG ACC CAG CGA TGA, LCP1 (PrimerBank ID 195546923c1) forward 5′- GAT CAG TGT CCG ATG AGG AAA TG, LCP1 reverse 5′- CCA GAT CAC CTG TAG CCA TCA, PLEK (PrimerBank ID 156616272c1):forward 5′- AAG AAG GGG AGC GTG TTC AAT, PLEK reverse 5′-TCA GCG GGA TCA TTC CTT TGG, RASEF (PrimerBank ID 40255118c2) forward 5′- TTC CCC TCA ACC TCT AGG CTA, RASEF reverse 5′-CAA CTT CAC AAT TTG TCC TCT GC. MCTP1 (PrimerBank ID 205361110c2) forward 5′- AGT TTA CGC CTA TCA GAC CTA CA, MCTP1 reverse 5′- GAT CGC TCA ACC CGT TGG AAT, β-actin forward (PrimerBank ID 4501885a1) 5′-CAT GTA CGT TGC TAT CCA GGC, reverse 5′-CTC CTT AAT GTC ACG CAC GAT (Wang et al. 2012).
Electrophoretic mobility shift assay (EMSA)
EMSA and supershift assay were performed as described previously (Shin et al. 2014). Briefly, for nuclear protein lysis, cytoplasmic proteins were first isolated using Buffer A (10 mM HEPES, pH: 7.9, 10 mM KCl, 0.1 mM EDTA, 0.1 mM EGTA, 1 mM DTT and 0.5 mM PMSF), followed by Buffer C lysis (20 mM HEPES, pH 7.9, 400 mM NaCl, 1 mM EDTA, 1 mM EGTA) with 1 mM DTT and 0.5 mM PMSF, 0.1% aprotinin or 1 × protease inhibitor with occasional vortexing. Five micrograms of nuclear protein were used for EMSA and supershift assay. Oligo sequences on LCP1 promoter used for EMSA are ETS (low binding) 5′- GAA GCC ACC AGG ATG TGG AAC CAG A, Gfi1 5′- CTA GAG AAA TCA AAA AAG CAA A, NF-κB2 5′- TGG GGT GGG GCT TTC CCA AGG AAG T, ETS1 and GAPBA common 5′- AAA AGA GGA AGT GGT AGG T. Antibodies for supershift assay were the same as listed in the immunoblotting section. EMSA and supershift images were scanned using Typhoon FLA 7000 (GE Life Science).
ChIP-seq and RNA-seq
Without stimulations, MM.1S, RPMI8226, U266, KMS11, JJN3, KMS28BM and XG7 cells were fixed with 1% formaldehyde for 30 min at room temperature and fixation was reversed with a final 0.125 M glycine with gentle shaking for 5 min. Following lysis, cell lysates were sonicated in fragments sized 200–500 bp and processed for ChIP-seq following standard protocols (Li et al. 2015). Fragmented DNA–protein complexes were precleared with protein A sepharose beads (Thermo Fischer Scientific) for 1 h and 2% of sample was stored as an input for CHIP-seq library preparation. Lysates (~ 20 million cells) were incubated with either 10 μg of anti-RelA/p65 (Santa Cruz Biotechnology Cat# sc-372, RRID:AB_632037) and anti-NFKB2/p52 (Abcam Cat# ab7972, RRID:AB_306186) antibodies to pull down RelA/p65 and p52 bound chromatin complexes, respectively, overnight at 4 °C on a rotator. Immune complexes were immunoprecipitated with protein A beads and samples were eluted and reverse crosslinked overnight for DNA purification using PCR purification kit (Qiagen). DNA concentration was determined by Qubit fluorometric quantification (Thermo Fischer Scientific) and Agilent 2100 Bioanalyzer and 10 μg DNA was used for library preparation using NEB Next Ultra II DNA library preparation Kit (New England Biolabs) according to the manufacturer’s instructions. For sequencing, HiSeq2500 system (Illumina) with high output run mode and paired-end sequencing (101 bp) was performed.
For RNA-seq, total RNA was isolated using TRIZOL method. RNA-seq libraries were prepared using Illumina TruSeq Total RNA sequencing Kit according to manufacturer’s instructions. Paired end sequencing was performed with Illumina HiSeq, 2 × 101 bp. RNA sequencing raw counts were analysed at transcript level using Kallisto and BioJupies.(Bray et al. 2016; Torre et al. 2018). Paired-end raw sequencing reads were pseudo aligned against to human GRCh38 reference genome with Kallisto using default settings. Pseudo aligned counts were further analysed using BioJupies to get differentially expressed genes between wild-type and mutant cells. Differentially expressed genes then used for GO enrichment analysis(Ashburner et al. 2000; The Gene Ontology 2019; Mi et al. 2019) For heatmap, first gene counts were log CPM normalized and then gene-wise Z-score was calculated. Illustrations are generated by GraphPad Prism version 8.00 for Windows, GraphPad Software, La Jolla California USA, www.graphpad.com.
NIK over-expression and shLCP1 knockdown
For NIK over-expression, N-terminal flag-tagged MAP3K14 was cloned into pBOBI vector as described previously (Shin et al. 2014). For shLCP1 experiments, shRNA sequences are selected using siRNA Wizard software from InvivoGen. Gene knockdown for LCP1, shLCP1#1 GGT ATA GAG TAC GAG AAA TTA, shLCP1#2 GGC ACC CAA CAC TCC TAT TCA, shLCP3# GAA CCC AAA CAC GAA TGA TCT T, and for NIK knockdown, shMAP3K14/NIK #1 GAA ACA GAGCTC CGT CTA CAA, shMAP3K14/NIK #2 GTG TGA GAA TAGC CAA GAG TT and shRNA control were cloned in pLKO.1-puro. MM1.S cells were selected with puromycin and recovered before used in the experiments.
Colony formation assay and cell viability assay
For colony formation assay, MM1.S cells were knock-downed either with shControl, shLCP1-1or shLCP1-2 and 2 × 10³ cells were seeded in poly-L-lysine pre-coated six-well plate and kept for 14 days. For cell viability assay, 1 × 10⁴ MM1.S cells knocked down either with shControl or shLCP1-1 were seeded in 12-well plate and treated with either DMSO, bortezomib five or 10 nM for 48 h.
Utilization of public transcriptome data
We utilized publicly available transcriptome data to explore clinical significance of target genes’ expression patterns. MAYO (GSE6477) data contain molecular profiles of 162 individuals encompassing normal, MGUS, smouldering MM, newly diagnosed MM, and relapse conditions performed on Affymetrix HG-U133A platform. For TC class analysis, we used MM patients’ data only. UAMS (GSE2658) data contain molecular profiles of 559 newly diagnosed MM patients performed on Affymetrix HG-U133 Plus two platform. MAS5 processed data downloaded from GEO were used for both.
Gene expression data of multiple myeloma patients was downloaded from NCBI Gene Expression Omnibus (GEO), GSE107593 (Ryu et al. 2020). Data consist of single cell RNA-Seq of CD138-positive cells and bulk RNA-Seq of CD138-negative cells from ten patients. Expression values (transcript per million, TPM) of LCP1 and MAP3K14 genes were extracted from the expression matrix and plotted in bar plot using R package (ggplot2). For single cell RNA-Seq data, mean expression value of the same patient and cell type was used. Survival analysis and tumour-normal expression comparison of LCP1 and MAP3K14 genes in acute myeloid leukaemia (LAML) were performed using GEPIA web server (Tang et al. 2017).
References
Akincilar, S. C., Low, K. C., Liu, C. Y., Yan, T. D., Oji, A., Ikawa, M., et al. (2015). Quantitative assessment of telomerase components in cancer cell lines. FEBS Letters, 589, 974–984.
Annunziata, C. M., Davis, R. E., Demchenko, Y., Bellamy, W., Gabrea, A., Zhan, F., et al. (2007). Frequent engagement of the classical and alternative NF-kappaB pathways by diverse genetic abnormalities in multiple myeloma. Cancer Cell, 12, 115–130.
Ashburner, M., Ball, C. A., Blake, J. A., Botstein, D., Butler, H., Cherry, J. M., et al. (2000). Gene ontology: tool for the unification of biology. The gene ontology consortium. Nature Genetics, 25, 25–29.
Bray, N. L., Pimentel, H., Melsted, P., & Pachter, L. (2016). Near-optimal probabilistic RNA-seq quantification. Nature Biotechnology, 34, 525–527.
Chew, C. L., Conos, S. A., Unal, B., & Tergaonkar, V. (2018). Noncoding RNAs: master regulators of inflammatory signaling. Trends in Molecular Medicine, 24, 66–84.
Cildir, G., Akincilar, S. C., & Tergaonkar, V. (2013). Chronic adipose tissue inflammation: all immune cells on the stage. Trends in Molecular Medicine, 19, 487–500.
Claudio, E., Brown, K., Park, S., Wang, H., & Siebenlist, U. (2002). BAFF-induced NEMO-independent processing of NF-kappa B2 in maturing B cells. Nature immunology, 3, 958–965.
Colaprico, A., Silva, T. C., Olsen, C., Garofano, L., Cava, C., Garolini, D., et al. (2016). TCGAbiolinks: an R/Bioconductor package for integrative analysis of TCGA data. Nucleic Acids Research, 44, e71.
Demchenko, Y. N., Brents, L. A., Li, Z., Bergsagel, L. P., McGee, L. R., & Kuehl, M. W. (2014). Novel inhibitors are cytotoxic for myeloma cells with NFkB inducing kinase-dependent activation of NFkB. Oncotarget, 5, 4554–4566.
Demchenko, Y. N., Glebov, O. K., Zingone, A., Keats, J. J., Bergsagel, P. L., & Kuehl, W. M. (2010). Classical and/or alternative NF-kappaB pathway activation in multiple myeloma. Blood, 115, 3541–3552.
Dubovsky, J. A., Chappell, D. L., Harrington, B. K., Agrawal, K., Andritsos, L. A., Flynn, J. M., et al. (2013). Lymphocyte cytosolic protein 1 is a chronic lymphocytic leukemia membrane-associated antigen critical to niche homing. Blood, 122, 3308–3316.
Dun, M. D., Chalkley, R. J., Faulkner, S., Keene, S., Avery-Kiejda, K. A., Scott, R. J., et al. (2015). Proteotranscriptomic profiling of 231-BR breast cancer cells: identification of potential biomarkers and therapeutic targets for brain metastasis. Molecular and Cellular Proteomics, 14, 2316–2330.
Fang, Z. Q., Zang, W. D., Chen, R., Ye, B. W., Wang, X. W., Yi, S. H., et al. (2013). Gene expression profile and enrichment pathways in different stages of bladder cancer. Genetics and Molecular Research: GMR, 12, 1479–1489.
Foran, E., McWilliam, P., Kelleher, D., Croke, D. T., & Long, A. (2006). The leukocyte protein L-plastin induces proliferation, invasion and loss of E-cadherin expression in colon cancer cells. International Journal of Cancer, 118, 2098–2104.
Grossman, R. L., Heath, A. P., Ferretti, V., Varmus, H. E., Lowy, D. R., Kibbe, W. A., et al. (2016). Toward a shared vision for cancer genomic data. New England Journal of Medicine, 375, 1109–1112.
Hacker, H., Redecke, V., Blagoev, B., Kratchmarova, I., Hsu, L. C., Wang, G. G., et al. (2006). Specificity in Toll-like receptor signalling through distinct effector functions of TRAF3 and TRAF6. Nature, 439, 204–207.
Hacker, H., Tseng, P. H., & Karin, M. (2011). Expanding TRAF function: TRAF3 as a tri-faced immune regulator. Nature REVIEWS Immunology, 11, 457–468.
Hayden, M. S., & Ghosh, S. (2008). Shared principles in NF-kappaB signaling. Cell, 132, 344–362.
Inaguma, S., Riku, M., Ito, H., Tsunoda, T., Ikeda, H., & Kasai, K. (2015). GLI1 orchestrates CXCR4/CXCR7 signaling to enhance migration and metastasis of breast cancer cells. Oncotarget, 6, 33648–33657.
Kawano, Y., Fujiwara, S., Wada, N., Izaki, M., Yuki, H., Okuno, Y., et al. (2012). Multiple myeloma cells expressing low levels of CD138 have an immature phenotype and reduced sensitivity to lenalidomide. International Journal of Oncology, 41, 876–884.
Keats, J. J., Fonseca, R., Chesi, M., Schop, R., Baker, A., Chng, W. J., et al. (2007). Promiscuous mutations activate the noncanonical NF-kappaB pathway in multiple myeloma. Cancer Cell, 12, 131–144.
Khattar, E., Kumar, P., Liu, C. Y., Akincilar, S. C., Raju, A., Lakshmanan, M., et al. (2016). Telomerase reverse transcriptase promotes cancer cell proliferation by augmenting tRNA expression. The Journal of Clinical Investigation, 126, 4045–4060.
Khattar, E., Maung, K. Z. Y., Chew, C. L., Ghosh, A., Mok, M. M. H., Lee, P., et al. (2019). Rap1 regulates hematopoietic stem cell survival and affects oncogenesis and response to chemotherapy. Nature Communications, 10, 5349.
Li, Y., Cheng, H. S., Chng, W. J., & Tergaonkar, V. (2016). Activation of mutant TERT promoter by RAS-ERK signaling is a key step in malignant progression of BRAF-mutant human melanomas. Proceedings of the National Academy Sciences USA, 113, 14402–14407.
Li, Y., Zhou, Q. L., Sun, W., Chandrasekharan, P., Cheng, H. S., Ying, Z., et al. (2015). Non-canonical NF-kappaB signalling and ETS1/2 cooperatively drive C250T mutant TERT promoter activation. Nature Cell Biology, 17, 1327–1338.
Lohr, J. G., Stojanov, P., Carter, S. L., Cruz-Gordillo, P., Lawrence, M. S., Auclair, D., et al. (2014). Widespread genetic heterogeneity in multiple myeloma: implications for targeted therapy. Cancer Cell, 25, 91–101.
Manojlovic, Z., Christofferson, A., Liang, W. S., Aldrich, J., Washington, M., Wong, S., et al. (2017). Comprehensive molecular profiling of 718 multiple myelomas reveals significant differences in mutation frequencies between African and European descent cases. PLoS Genetics, 13, e1007087.
Medzhitov, R. (2008). Origin and physiological roles of inflammation. Nature, 454, 428–435.
Mi, H., Muruganujan, A., Ebert, D., Huang, X., & Thomas, P. D. (2019). PANTHER version 14: more genomes, a new PANTHER GO-slim and improvements in enrichment analysis tools. Nucleic Acids Research, 47, D419–D426.
Ning, Y., Gerger, A., Zhang, W., Hanna, D. L., Yang, D., Winder, T., et al. (2014). Plastin polymorphisms predict gender- and stage-specific colon cancer recurrence after adjuvant chemotherapy. Molecular Cancer Therapeutics, 13, 528–539.
Oganesyan, G., Saha, S. K., Guo, B., He, J. Q., Shahangian, A., Zarnegar, B., et al. (2006). Critical role of TRAF3 in the Toll-like receptor-dependent and -independent antiviral response. Nature, 439, 208–211.
Ooi, M. G., de Mel, S., & Chng, W. J. (2016). Risk stratification in multiple myeloma. Current Hematologic Malignancy Reports, 11, 137–147.
Ozturk, M. B., Li, Y., & Tergaonkar, V. (2017). Current insights to regulation and role of telomerase in human diseases. Antioxidants (Basel), 6(1), 17. https://doi.org/10.3390/antiox6010017.
Puar, Y. R., Shanmugam, M. K., Fan, L., Arfuso, F., Sethi, G., & Tergaonkar, V. (2018). Evidence for the involvement of the master transcription factor NF-kappaB in cancer initiation and progression. Biomedicines, 6(3), 82. https://doi.org/10.3390/biomedicines6030082.
Ranuncolo, S. M., Pittaluga, S., Evbuomwan, M. O., Jaffe, E. S., & Lewis, B. A. (2012). Hodgkin lymphoma requires stabilized NIK and constitutive RelB expression for survival. Blood, 120, 3756–3763.
Ryu, D., Kim, S. J., Hong, Y., Jo, A., Kim, N., Kim, H. J., et al. (2020). Alterations in the transcriptional programs of myeloma cells and the microenvironment during extramedullary progression affect proliferation and immune evasion. Clinical Cancer Research, 26, 935–944.
Shin, E. M., Hay, H. S., Lee, M. H., Goh, J. N., Tan, T. Z., Sen, Y. P., et al. (2014). DEAD-box helicase DP103 defines metastatic potential of human breast cancers. The Journal of Clinical Investigation, 124, 3807–3824.
Stuhmer, T., Chatterjee, M., Hildebrandt, M., Herrmann, P., Gollasch, H., Gerecke, C., et al. (2005). Nongenotoxic activation of the p53 pathway as a therapeutic strategy for multiple myeloma. Blood, 106, 3609–3617.
Su Kim, D., Choi, Y. D., Moon, M., Kang, S., Lim, J. B., Kim, K. M., et al. (2013). Composite three-marker assay for early detection of kidney cancer. Cancer Epidemiology, Biomarkers and Prevention: a Publication of the American Association for Cancer Research, Cosponsored by the American Society of Preventive Oncology, 22, 390–398.
Sun, S. C. (2011). Non-canonical NF-kappaB signaling pathway. Cell Research, 21, 71–85.
Takeuchi, O., & Akira, S. (2010). Pattern recognition receptors and inflammation. Cell, 140, 805–820.
Tang, Z., Li, C., Kang, B., Gao, G., Li, C., & Zhang, Z. (2017). GEPIA: a web server for cancer and normal gene expression profiling and interactive analyses. Nucleic Acids Research, 45, W98–W102.
The Gene Ontology, Consortium. (2019). The gene ontology resource: 20 years and still going strong. Nucleic Acids Research, 47, D330–D338.
Torre, D., Lachmann, A., & Ma'ayan, A. (2018). BioJupies: automated generation of interactive notebooks for RNA-seq data analysis in the cloud. Cell Systems, 7(556–61), e3.
Vallabhapurapu, S., & Karin, M. (2009). Regulation and function of NF-kappaB transcription factors in the immune system. Annual Review of Immunology, 27, 693–733.
Wang, C. Q., Chin, D. W., Chooi, J. Y., Chng, W. J., Taniuchi, I., Tergaonkar, V., et al. (2015). Cbfb deficiency results in differentiation blocks and stem/progenitor cell expansion in hematopoiesis. Leukemia, 29, 753–757.
Wang, X., Spandidos, A., Wang, H., & Seed, B. (2012). PrimerBank: a PCR primer database for quantitative gene expression analysis, 2012 update. Nucleic Acids Research, 40, D1144–D1149.
Wen, D., Nong, Y., Morgan, J. G., Gangurde, P., Bielecki, A., Dasilva, J., et al. (2006). A selective small molecule IkappaB kinase beta inhibitor blocks nuclear factor kappaB-mediated inflammatory responses in human fibroblast-like synoviocytes, chondrocytes, and mast cells. The Journal of Pharmacology and Experimental Therapeutics, 317, 989–1001.
Xiao, G., Fong, A., & Sun, S. C. (2004). Induction of p100 processing by NF-kappaB-inducing kinase involves docking IkappaB kinase alpha (IKKalpha) to p100 and IKKalpha-mediated phosphorylation. The Journal of Biological Chemistry, 279, 30099–30105.
Xiao, G., Harhaj, E. W., & Sun, S. C. (2001a). NF-kappaB-inducing kinase regulates the processing of NF-kappaB2 p100. Molecular Cell, 7, 401–409.
Xiao, G., Harhaj, E. W., & Sun, S. C. (2001b). NF-kappaB-inducing kinase regulates the processing of NF-kappaB2 p100. Molecular Cell, 7, 401–409.
Xie, P., Stunz, L. L., Larison, K. D., Yang, B., & Bishop, G. A. (2007). Tumor necrosis factor receptor-associated factor 3 is a critical regulator of B cell homeostasis in secondary lymphoid organs. Immunity, 27, 253–267.
Xu, Y., Cheng, G., & Baltimore, D. (1996). Targeted disruption of TRAF3 leads to postnatal lethality and defective T-dependent immune responses. Immunity, 5, 407–415.
Xu, X., Li, Y., Bharath, S. R., Ozturk, M. B., Bowler, M. W., Loo, B. Z. L., et al. (2018). Structural basis for reactivating the mutant TERT promoter by cooperative binding of p52 and ETS1. Nature Communications, 9, 3183.
Yuregir, O. O., Sahin, F. I., Yilmaz, Z., Kizilkilic, E., Karakus, S., & Ozdogu, H. (2009). Fluorescent in situ hybridization studies in multiple myeloma. Hematology, 14, 90–94.
Zarnegar, B. J., Wang, Y., Mahoney, D. J., Dempsey, P. W., Cheung, H. H., He, J., et al. (2008). Noncanonical NF-kappaB activation requires coordinated assembly of a regulatory complex of the adaptors cIAP1, cIAP2, TRAF2 and TRAF3 and the kinase NIK. Nature Immunology, 9, 1371–1378.
Zhao, B., Barrera, L. A., Ersing, I., Willox, B., Schmidt, S. C., Greenfeld, H., et al. (2014). The NF-kappaB genomic landscape in lymphoblastoid B cells. Cell Reports, 8, 1595–1606.
Acknowledgements
We thank Dr. Manikandan Lakshmanan, Dr. Chew Chen Li, Dr. Lee Sook Yee, Dr. Gireedhar Venkatachalam for their productive discussions and suggestions for the manuscript.
Funding
This study was funded by Singapore Ministry of Health, National Medical Research Council Grant NMRC/CNIG/1170/2017.
Author information
Eun Myoung Shin and Sultan Abda Neja shared first authorship.
Affiliations
Laboratory of NFκB Signaling, Institute of Molecular and Cell Biology (IMCB), A*STAR (Agency for Science, Technology and Research), Singapore, 138673, Singapore
Eun Myoung Shin, Kerem Fidan, Joelle Yi Heng Chua & Vinay Tergaonkar
Cancer Science Institute of Singapore, Singapore, 117599, Singapore
Tae-Hoon Chung & Wee-Joo Chng
Genome Institute of Singapore, A*STAR, Singapore, 138672, Singapore
Nicolas Bertin
Department of Biochemistry, Yong Loo Lin School of Medicine, National University of Singapore (NUS), Singapore, 117597, Singapore
Vinay Tergaonkar
Department of Medicine, Yong Loo Lin School of Medicine, National University of Singapore, Singapore, 119228, Singapore
Wee-Joo Chng & Melissa Gaik-Ming Ooi
Department of Hematology-Oncology, National University Cancer Institute of Singapore, National University Health System, Singapore, 119074, Singapore
Wee-Joo Chng & Melissa Gaik-Ming Ooi
Department of Pathology, Yong Loo Lin School of Medicine, National University of Singapore, Singapore, 119074, Singapore
Vinay Tergaonkar
Centre for Cancer Biology, University of South Australia and SA Pathology, Adelaide, SA, 5000, Australia
Vinay Tergaonkar
Denome Technologies, Singapore, 138673, Singapore
Kerem Fidan
Hawassa University, Awasa, Ethiopia
Sultan Abda Neja
Contributions
EMS performed the majority of experiments, SAN prepared RNA-seq samples, THC, NB, KF, JYHC performed bioinformatics studies. VT, WJC and MO designed the study and EMS and MO drafted the manuscript.
Corresponding author
Correspondence to Melissa Gaik-Ming Ooi.
Ethics declarations
Conflict of interest
The authors declare no conflicts of interests.
Electronic supplementary material
Below is the link to the electronic supplementary material.
Supplementary file1 (DOCX 18 kb)
Supplementary file2 (PDF 918 kb)
Rights and permissions
About this article
Cite this article
Shin, E.M., Neja, S.A., Fidan, K. et al. Lymphocyte cytosolic protein 1 (LCP1) is a novel TRAF3 dysregulation biomarker with potential prognostic value in multiple myeloma. GENOME INSTAB. DIS. 1, 286–299 (2020). https://doi.org/10.1007/s42764-020-00014-x
Received 27 March 2020
Revised 15 May 2020
Accepted 16 May 2020
Published 02 June 2020
Issue Date September 2020
Share this article
Anyone you share the following link with will be able to read this content:
Get shareable linkKeywords
Lymphocyte cellular protein 1 (LCP1)
NF-κB inducing kinase (NIK)
TNF receptor associated factor 3 (TRAF3)
Non-canonical NF-κB
Multiple myeloma




用户登录
还没有账号?
立即注册