Differential molecular alterations promoting non-small cell lung cancer under hypoxia
Original Research Paper
Genome Instability & Disease 3, 108–121 (2022)
Abstract
Hypoxia is one of the hallmarks of the solid cancer microenvironment that dominates cancer progression and exacerbation. Under the oxygen-deprived condition, cancer resists and circumvents all interventions for permanence. Genomic and genetic instability of hypoxic cancer remains to be insightfully investigated and interpreted, as in lung adenocarcinoma. Herein, non-small cell lung cancer (NSCLC) cell line A549 was exposed to hypoxic shots parallel with running non-hypoxic (normoxic) A549 cells. Based on the isolated total RNA, gene transcriptomic profiling was identified using microarray and analysed via Ingenuity Pathway Analysis (IPA). As well, wound healing and cytotoxicity of doxorubicin were performed to assess hypoxic lung cancer cell response. Gene expression analysis revealed that TP53 (p53) is the most activated signaling, along with suppression of chromosomal signalings (DNA replication and repair). Besides, TP53 and its dependent target CDKN1A/p21 (cell cycle down-regulator) were identified as the topmost significant upstream transcriptional regulators, commanding a 37-gene targetable panel for cancer survival. In addition, hypoxic A549 cells were more chemo-resistant and higher motile. Notably, other emerging alterations were detected regarding efflux transporters (ABC-As and ABC-G1) that have been selectively up-regulated over the rest of under-transcribed (ABC) transporters subfamilies. Together, these involved findings suggest that the p53 signaling could be a potential survival mediator of hypoxic NSCLC cells (A549), which triggered the prominent cell cycle down-regulation to frustrate apoptotic response in hypoxic NSCLC. Coupled with the impairing of DNA replication and repair signalings that promoted molecular alterations for survival. Represented by the remarkable epithelial-mesenchymal transition of hypo-proliferating hypoxic A549 cells by which was described at the transcriptional level alongside phenotypic level. Consequently, hypoxic A549 cells showed higher resistance to doxorubicin targeting DNA replication, regardless of any transcriptionally down-regulated (ABC) transporters.
Introduction
Lung carcinoma is still constantly perceived as the principal cause of cancer mortality in males and a secondary cause in females globally (Ferlay et al., 2021). Non-small cell lung cancer (NSCLC) is the prevailing histotype of lung cancer by 85% (Herbst et al., 2008; Rodriguez-Canales et al., 2016). Since genetic alterations consider as a driving force of carcinogenesis and cancer development, omics-derived data are widely used in terms of comprehensive profilings amenable for analysis and translation; providing an insightful tackling in the therapeutic field in relation to outlining the targetable biomarkers that underlying cancer endurance and aggravation features.
Hypoxia is one of the most stressful phenomena that predominates solid tumor microenvironment. Characterizing by the declining oxygen level < 2% that promotes tumor’s distinct molecular biology to arise a more tolerable and aggressive tumor response (Harris, 2002; Muz et al., 2015). The intermittent hypoxic pattern (cycling) refers to the successive cycles of hypoxia and reoxygenation within various time intervals (Bayer & Vaupel, 2012), which deregulates the gene expression profiling and reprograms the constitutive signaling pathways for persistence (Liu et al., 2010; Olbryt et al., 2014). This pattern of hypoxia prevails in the solid tumor microenvironment more than others with more detrimental tumor progressions (Bhaskara et al., 2012; Cairns et al., 2001; Chen et al., 2018a, 2018b; Verduzco et al., 2015). In lung cancer, hypoxia has an influential role in chemotherapy and radiotherapy resistance, as well as the exacerbation characteristic of highly metastatic tendency with a notable poor prognostic value in NSCLC patients (Mittal et al., 2016; Salem et al., 2018).
Targeting hypoxia in NSCLC and other cancers remains to be further examined and validated to find out the hypoxic molecular signature that dictates the downstream regulators as conceivable biomarkers. In this concerned research, we present the high-throughput transcriptomic profiling of NSCLC cells (A549) under distinct intermittent hypoxic conditions. Besides, uncovering the principal regulators and the canonical intracellular pathways, which govern the survival of the hypoxic lung adenocarcinoma model.
Materials and methods
Non-small cell lung cancer cell culture (A549)
The human lung adenocarcinoma cell line A549 was provided from the American Tissue culture collection (ATCC® CCL-185™, RRID: CVCL_0023). A549 cell line was proliferated via Dulbecco’s Modified Eagles’ Medium High Glucose, which supplemented with 2 mM L-glutamine (Euro Clone, Italy), 10% (v/v) heat-inactivated fetal bovine serum (Biowest, South America), and 100 μg/ml penicillin–streptomycin (Euro Clone, Italy). A549 cells were grown on 75 cm filter capped culture flasks, attached types (SPL life sciences, Korea). The incubation condition was (5% CO2) 95% atmospheric air (normoxia state) at 37 °C in a cell culture incubator (Nuaire, USA). These involved cells were divided into hypoxic cells and non-hypoxic cells (normoxic) as an experimental group and control group, respectively.
Intermittent hypoxic exposure (Cycling hypoxia)
The experimental group of A549 cells was exposed to hypoxic conditions via AnaeroGen Compact sachets (Oxoid, UK) (Alhawarat et al., 2019; Chenevier-Gobeaux et al., 2013). These sachets contain ascorbic acid and activated carbon can react immediately in contact with air and consume oxygen levels. Hence, it diminishes oxygen concentration to less than 1%. By this hypoxic model, A549 cells have been exposed to ten shots of continuous 72 h of acute hypoxia per one shot (Bayer & Vaupel, 2012; Jarrar et al., 2020), alternating with rest intervals (reoxygenation) ranging from 1 to 5 days creating an intermittent hypoxic pattern. The control A549 group was proliferated under normoxic incubation conditions in parallel with hypoxic cells.
At the end of ten shots of intermittent hypoxia, the following assays and procedures were conducted for both lines of A549;
Chemoresistance investigation
By applying Cell Titer 96® Non-Radioactive Cell Proliferation Assay (MTT) (Promega, USA), doxorubicin cytotoxicity was investigated after ten intermittent hypoxic shots. After seeding hypoxic and normoxic cells into 96-well plates (Corning, USA), doxorubicin concentrations starting from 0.1 μM up to 60 μM were used. 15 µl of MTT was added to the doxorubicin-treated 96-well plates after 72 h incubation. As per the colorimetric test principle, mitochondrial reduction of 3-(4, 5dimethylthiazol-2-yl)-2, 5-diphenyl tetrazolium bromide (MTT) a yellow tetrazole to purple formazan after 4 h incubation signifies the viability of cells. This mitochondrial reduction was recognized in viable lung cancer cells, whereas no color change in non-viable cells. Then, adding 100 µl of the solubilizing agent to measure the optical density of solubilized formazan, which was determined through a Synergy multi-mode reader (Biotek, USA). Graph Pad PRISM® 8.0.1(443) (Graph Pad Software, Inc.) was selected for readings analysis.
Wound-healing assay
Wound healing was assessed for hypoxic cells vs. normoxic ones. Both groups were scratched on a 12-well plate (Corning, USA). By aiding the yellow pipette tip, a straight scratch was made in every well that contained 100,000 cells as a monolayer. Wound images were taken at 0, 24, and 40 (h) under an inverted light microscope camera (Leica, USA) for both groups of A549 cells.
Ribonucleic acid (RNA) isolation
Total RNA extraction from the 10th hypoxic A549 cells and normoxic A549 counterparts was applied according to the RNeasy Plus Mini Kit protocol (Qiagen, USA). RNA samples were preserved under − 80 °C for the next step. NanoDrop 2000 UV–Vis Spectrophotometer (Thermo Scientific, USA) was utilized to determine RNA purity, and the absorbance ratio of RNA samples has achieved the range (1.9–2.2) at 260/280 nm. RNA integrity of both groups was confirmed by gel electrophoresis for proceeding further to the next step of microarray-based gene expression analysis.
Gene expression profiling
Biological duplicates of RNA samples have been sent to get microarray-based gene expression profiling via (Affymetrix Gene Chip®). RNA was processed and hybridized to Human Gene 2.0 ST Array as provided in Supplementary Fig. 1.
Affymetrix-derived essential analyses have been attached as the next; Sample Data Quality Check (Supplementary Fig. 2) and Hierarchical Clustering Heatmap (Supplementary Fig. 3).
Microarray data analysis via ingenuity pathway analysis (IPA)
The revealed genes dataset was analyzed by adopting Qiagen digital insights-derived IPA (QIAGENInc., https://digitalinsights.qiagen.com/products-overview/discovery-insights-portfolio/analysis-and-visualization/qiagen-ipa/) that is the bioinformatics- and omics-based analysis platform to get an insightful molecular data interpretation and elucidation. The point of our interest was initially performing core analysis to get the differential alterations of the canonical pathway analysis (CPA), downstream effect analysis (DEA), and upstream transcriptional regulators (UTRs).
Results
Phenotype alteration of A549 cells under intermittent hypoxia
Hypoxic A549 cells had obvious morphology changes from 1st hypoxic shot to the 10th shot, represented by persistent elongation with increased hypoxic shots exhibiting a profound epithelial-mesenchymal transition (EMT). Hypoxic A549 showed notable regressed proliferation density compared with normoxic counterparts that retained their top proliferation rate, as shown in Fig. 1, the difference between first hypoxic shots and the last shots (a–d).
Fig. 1
Phenotype alteration of normoxic A549 vs. hypoxic A549. Hypoxic A549 cells had an ongoing transformation, whereas normoxic A549 cells kept the epithelial-like shape and rapid proliferation rate compared with hypoxic counterparts (a–d). Together with a dissimilar proliferation density between both groups and within the hypoxic group starting from the 1st and 2nd shots (a and b) to the last shots of 9th and 10th, as furthered with passage numbers (P). All the captured images at 10 × magnification under the microscope (a–d)
Full size imageCellular movement of hypoxic cells
In observation of wound healing (Fig. 2), hypoxic A549 cells were distinguished from normoxic cells by clear movement manifested by cells' detachment individually toward the established wound, differently of normoxic cells that were pushed collectively with clear wound area separates both wound edges, as shown after 24 h (Fig. 2b). Both groups of hypoxic and normoxic cells have progressed the wound healing at 40 h (Fig. 2c); however, the healing pattern after 24 h at the hypoxic cell-filled wound line was more apparent than normoxic cells that were neared more along the wound edges, without cells' detachment nor connection (Fig. 2b).
Fig. 2
Hypoxic (H) Vs. Normoxic (N) A549 Wound Healing. At 24 h, the closest link between two wound edges was detected in the group of hypoxic motile cells, although the normoxic counterparts had a prominent proliferation (b). Both groups of cells had a similar endpoint of healing progress at 40 h (c). 10 × magnification (a, b, and c)
Full size imageChemoresistance (doxorubicin) of hypoxic A549 cells
Doxorubicin-response curve (Fig. 3a) revealed an alteration of the 50% maximal doxorubicin inhibition effect (IC50) and shifting from 0.6761 μM in the normoxic cells to 1.7579 μM in the comparative hypoxic cells. Thus, hypoxic A549 gained resistance against doxorubicin by 1.6-fold of what had normoxic A549 cells. It is known that A549 cells are doxorubicin-resistant, and have risen further after intermittent hypoxic exposure. Hypoxic A549 cells were more resistant to all doxorubicin concentrations in comparison with normoxic cells as plotted in Fig. 3b. Among the different doxorubicin concentrations that were used;1 μM, 10 μM, 30 μM, and 60 μM had significant statistical differences relative to the normoxic group (Fig. 3b).
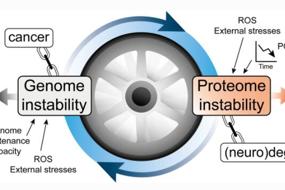
Fig. 3
Viability of doxorubicin-treated A549 cells. (a) Doxorubicin-response curve of hypoxic vs. normoxic A549, showing Dox IC50 shift to the right-handed side from 2.83 to 3.245, as a log [Dox Conc.]. (b) Statistical significance of A549 viability (%) at doxorubicin concentrations individually, illustrating that 60 μM, 30 μM, 10 μM, and 1 μM have a statistically significant difference on A549 viability in hypoxic vs. normoxic group. The most significant concentration was 1 μM (b). Results were annotated as mean ± SEM, P: (*) < 0.05 and (***) < 0.001 based on the unpaired T test. 1: N. log [676.1nM] = 2.83. 2: H. log [1757.9nM] = 3.245
Full size imageMicroarray-based gene transcriptomic profiling
Affymetrix-Human Gene 2.0 ST platform revealed over 6000 differentially expressed genes. 3669 genes have followed the selected cutoffs; |fc|≥ 2 and false discovery rate (FDR/q value) ≤ 0.05 of LPE test, as listed in Table 1 and plotted in Fig. 4.
Table 1 Significantly altered genes of hypoxic vs. normoxic A549 cellsFull size tableFig. 4
Volcano plot of differentially expressed genes in Table 1. The right-hand side represents the up-regulated genes (red-colored dots), and the down-regulated genes at the left-hand side (blue-colored dots). The threshold was set at 1.3(−log10 (0.05))
Full size imageThe concerned IPA-uploaded gene dataset (3669 genes) has relied on the additional IPA-based statistical analysis of Fisher's exact test p value, to exhibit more statistical power. And also, IPA-derived z-score calculation to predict the relevant activation state.
IPA-derived canonical pathway analysis (CPA)
The most enriched pathways were ranked according to the statistical significance along with the z-score prediction state. The activation or inhibition state was illustrated by a colored Bar chart depending on the positivity or negativity of the z-score (Fig. 5). P53 signaling (Fig. 6) achieved the highest activation state (z: 2.646), in addition to the activation of p53-associated axes regarding cell cycle phases as plotted in Fig. 5. The most suppressed pathway was the cell cycle control of chromosomal replication (− 5.303), likewise, the down-regulation of DNA repair signalings.
Fig. 5
Canonical pathway analysis bar chart. CPA depended on the statistical significance (−log p-value) and z score calculations. Orange color intensity is positively correlated with the activation state, whereas blue color intensity is correlated with the inhibition state. The threshold level was set as a −log (0.05) = 1.3. NER: nucleotide excision repair; ATM: Ataxia telangiectasia mutated
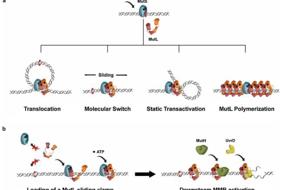
Full size imageFig. 6
p53 signaling. The colored molecules denote the overlapped genes dataset, labeled with the related fold change and FDR value. Red color intensity is positively correlated with upregulated genes, whereas green color is correlated with downregulated genes. Uncolored molecules denote the un-overlapped genes dataset. Log2 fold changes of the selected genes' fold changes were listed in Table 1. Different relationships indications have been demonstrated in Supplementary Fig.4. "*": asterisk indicates that multiple identifiers in the dataset file map to a single gene in the Global Molecular Network
Full size imageIPA-derived downstream effects analysis (DEA)
DEA delineated the constitutive biological functions and diseases that had a statistically significant overlapping with the revealed genes dataset, resulting in the most altered downstream effects. Exemplified by cell cycle; proliferation-related downstream effects; cancer; cellular movement (Fig. 7). "Cell cycle" had the most statistically significant downstream effect, and "Cancer" had the highest overlapping genes by around 60% of the analyzed genes dataset.
Fig. 7
Downstream effect analysis bar chart. The enriched downstream effects were illustrated according to the statistical significance (−log p value). DEA was signified to the cell cycle as the top-ranked downstream effect. In conjugation with overlapping genes, cancer was figured out with the highest overlapping genes. The threshold level was set as a −log (0.05) = 1.3
Full size imageIPA-derived upstream transcriptional regulators (UTRs)
UTR algorithm clarified key regulators of the transcriptional alterations. As the next, TP53 (p53) and CDKN1A (p21) were one of the top-ranked significant upstream regulators based on the overlapping of uploaded genes dataset with transcriptional regulator-dependent genes. Featured with overlapping p-value: 1.83E-51 and 2.08E-16, respectively, also, the activated prediction state that relating to z-score of 9.419 and 4.449, respectively.
Besides, 765 gene- and 741gene-based mechanistic networks were regulated by TP53 (p53) and CDKN1A (p21), respectively, which control the hypoxic transcriptomic profiling directly and indirectly. These mechanistic networks were filtered and prioritized for the most direct connection, resulting in a 37-gene targetable panel that is displayed in a hierarchical network of UTRs analysis (Fig. 8); ACTA2, BBC3, BIRC5, BRCA1, CCNA2, CCNB1, CCND3, CDC25A, CDC25B, CDC25C, CDK1, CHEK1, COL4A1, CSF2, DUSP1, EXO1, GADD45A, H2AX, IL6, ITGB5, LBR, LIMA1, MAD2L1, MBNL2, MCM4, MCM5, PCLAF, PLK1, POLD1, RAD51, RFC4, RRM1, STMN1, TGFA, TOP2A, TP53I3, and UBE2C. The related canonical pathways have been highlighted in this illustration, in addition to manifesting the relevant downstream effects of the resulting targetable gene panel (Fig. 8). All the involved relationships and network shapes of the selected figure are described in Supplementary Table 1 and Supplementary Fig. 4.
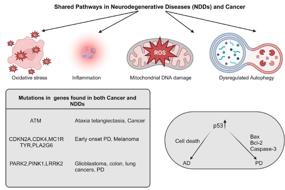
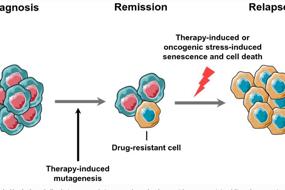
Fig. 8
Upstream transcriptional regulator analysis. TP53 and its downstream target CDKN1A (upper hierarchical nodes) are the upstream regulators, regulating a 37-gene targetable panel (middle lined up nodes). The targetable genes panel disclosed the promotion of critical downstream effects (lower hierarchical nodes). Malignant tumor development is the prominent end point that is linked to the most of genes panel. As well as increase invasion, DNA damage response, and decrease cancer proliferation. Aqua lines network signified to the overlapping the concerned canonical pathways (CP) with UTRs (TP53 and CDKN1A) and the 37-gene targetable panel. Resulted network shapes and different connection lines were further defined in Supplementary Fig. 4. "*": asterisk indicates that multiple identifiers in the dataset file map to a single gene in the Global Molecular Network
Full size imageDiscussion
Concerning this research, the point of interest was the molecular alterations developing NSCLC as a result of exposure to intermittent hypoxic stress that in turn enhances survival-related genetic instability. Initiating from an investigation of the resulting CPA, we have detected the predictive alteration of cellular stress response axes represented by p53 signaling (Fig. 5). Under severe stress, p53 signaling incites the transcription of downstream cell cycle regulators (Vogelstein et al., 2000); CDKN1A/p21 and GADD45A (Figs. 6 and 8) that mediated cell cycle down-regulation in these A549-harbored (p53-wild type). This was supported by UTR analysis outcomes of p53-dependent increasing DNA damage response and decreasing cancer proliferation that led to developing remarkable malignant tumor response (Fig. 8). Which can be validated in-depth via CPA of positive enrichment of checkpoints and the negative enrichment of cyclins, which are all in line with DEA results.
In view of DNA damage and repair among these hypoxic cells, ATM kinase is one of the foremost regulators activating the dependent targets; p53, p21, Chk, and Brca1 (Jin & Oh, 2019). Alternatively, CPA illustrated a significant declining activity of ATM-regulated axes despite the activation of p53-regulated axes (Figs.5 and 6). Earlier, the binary state of (ATM/CHK) suppression along with concurrent functional p53 signaling has aggravated lung cancer chemoresistance, and also, in breast cancer, the combined ATM deficiency and p53-wild type have been linked with a poor survival rate (Jiang et al., 2009). Determining the prominence of dissimilar ATM and p53 binary status in cancer progression and increasing metastasis, as in pancreatic malignancy (Drosos et al., 2017), that in turn, highlights the surpassed metastatic tendency of these hypo-proliferative hypoxic NSCLC. Featured by overexpression of EMT-related factors: SNAI2/slug (Fig. 6), SMAD-2/5, ZEB1 (Peinado et al., 2007) (Table 1), and AXL (Wu et al., 2014) (Table 1). Comparable to lessening an epithelial marker CDH1(Table 1) that coincided with the up-regulation of invasiveness and mesenchymal-related biomarker CXCR4 (Muz et al., 2015) (Table 1). Besides, LOX and LOXL2 invasion mediators (Chan et al., 2019) have attained fold-changes of 12 and 3.9, respectively, with respect to log2F.C (Table 1). In lung adenocarcinoma, ACTA2 up-regulation was linked with distant metastases and poor prognosis (Popper, 2016), which is one of the UTR-derived axes of invasion and malignant tumor (Fig. 8). Taking into account hypoxic A549 increasing motility potential that exceeded normoxic cells (Fig. 2b), both groups of hypoxic and normoxic ones have approximately the same healed-wound pattern at 40 h (Fig. 2c). Due to the fact of the well-known high proliferation rate of normoxic A549 that has been already recognized (Fig. 1), whereas the acquisition of high motility of hypoxic cells surpassed the regressed proliferation at these cells. However, initiating healing progress within hypoxic cells has preceded normoxic cells' healing (Fig. 2b).
Herein, the furthermost suppressed pathway of CPA (cell cycle control of chromosomal replication) is ascribed preferentially to the impairment of doxorubicin molecular cytotoxicity. Thereby hypo-proliferative hypoxic A549 cells were less vulnerable to doxorubicin-targeted genomic replication, which was emphasized by fold change of doxorubicin-dependent target TOP2A (Du et al., 2011) that has been extremely down-regulated by an 18-fold decrease (log2F.C:-4.147), and also the negative regulation of TOB2B and TOPBP1 (Table 1). Consistent with the genetic alterations of doxorubicin-resistant breast cancer cells (AbuHammad & Zihlif, 2013), which signifies the regulation state of the following expressed genes CDKN1A (Figs. 6 and 8), BRCA1 (Figs. 6 and 8), TOP2A (Fig. 8), BRCA2, NFKB2, and CYP1A1 (Table 1). In comparison to the last one CYP1A1, CYP4F2 has overexpressed by a sixfold change (log2F.C:2.77) for the first time in this selected NSCLC (A549) model, outdoing CYP1A1 (Table 1). It is known that CYP4F2 polymorphism has been correlated with NSCLC incidence and chemotherapy response (Wang et al., 2018), which necessitates more extended studies to reveal the remarkable role of CYPs metabolizing enzymes under hypoxia stress.
Considerably, the unexpected down-regulation of efflux transporters (ATP-binding cassette) has been noted, which in turn should increase doxorubicin sensitivity (Greaves et al., 2012; Roh et al., 2018; Yousaf & Ali, 2020). In the same context, the Rab5A-ABC (G2) and FOXM1-ABC (G2) axes have enhanced doxorubicin cytotoxicity, amidst the regression of ABC (G2) expression along with up-regulation of Rab5A and down-regulation of FOXM1, respectively (Roh et al., 2018; Yousaf & Ali, 2020). However, here, the concerned outcomes uncovered maintaining doxorubicin resistance by concurrently with the same involved state of both dependent axes (Table 1) achieving Dox.IC50 by 1.7579 μM. Presuming that the above-concerned doxorubicin impairment mechanism might surpass the prominent role of ABCs-associated doxorubicin resistance, under hypoxia. On the other hand, the overexpressions of ABC-A subfamily members and ABC-G (1) member have been observed only of the whole ABCs’ expressed families in these hypoxic A549 cells (Table 1), to be rendered as potential mediators for doxorubicin resistance under hypoxia among A549 cells. Further investigations of the extensive role of ABCs in chemoresistance under hypoxic circumstances could reveal interesting findings.
Given the p53-p21 axis (UTR), it is exhibited the protective role within hypoxic lung cancer cell (A549) to thwart acute stress mediating apoptosis, underlining the anti-apoptotic effect of p53-up-regulated regulators; p21 (Figs. 6 and 8), TIGAR (Fig. 6), MDM2 (Fig. 6), GPX, and EGFR (Jänicke et al., 2008; Sermeus & Michiels, 2011) (Table 1). Although the up-regulation of p53-associated apoptotic mediators (Fig. 6), the anti-apoptotic aspect predominated the pivotal role of p53 signaling assisted by raising senescence signaling [4.96 as shown in CPA (Figs. 5 and 6)] rather than apoptosis (0.45 not shown in CPA, below threshold). Hence, hypoxic A549 cells' endurance and movement were also furthered by senescence-linked secretory distinct patterns (Coppé et al., 2010; Mavrogonatou et al., 2020). Overexpressions of senescence-related factors have been identified; IL-6 (Fig. 8), SERPINE1/PAI-1 (Fig. 6), CDKNIs (Figs. 6 and 8), and NF-KB (Di et al., 2014; Jat et al., 2013) (Table 1). Especially with RRAD overexpression [increased by a 10.4-fold of change (log2 F.C:3.379)] as a key factor to counter the deleterious senescence effect for maintaining survival, via NF-KB-RRAD and p53-RRAD axes (Table 1) (Wei et al., 2019).
Additively, in the scope of cancer metabolism, p53 signaling negatively correlated with (aerobic) glycolysis that dominates cancer metabolism (Warburg effect), aided by the metabolic regulator TIGAR (Fig. 6) (Zhang et al., 2010). However, under intermittent hypoxic stress, we have noticed no fold change of glycolysis-dependent genes that were indicated previously (Jarrar et al., 2020), and also, neither glucose transporters nor LDH (lactate dehydrogenase); the promoter of the end product of aerobic glycolysis. Furthermore, diminishing pentose pathway shift; G6PD, PGD, RPE, TALDO1, and TKT (Fig. 5; Table 1). To suggest ultimately that no alterations in aerobic glycolysis approaching a static glycolysis metabolic pattern, which is in line with the constraining of cancer metabolic rate and cell cycle down-regulation under deprived conditions. This was shown up by p53-dependent transcriptional target DRAM1 (Fig. 6; Table 1) as an autophagy inducer and positive regulator of the autophagy/EMT axis in cancer (Chen et al., 2018a, 2018b; Zhang et al., 2010).
Based on the selected cut-off point (|fc|≥ 2), fundamentally, the TP53 (p53) fold change was not found in the revealed gene dataset; nevertheless, up-regulation of TP53-inducible proteins was detected (Table 1). Also, the up-regulation of MDM2 (log2 F.C:2.879), which is a downstream target and negative regulator of p53. This could be interpreted by acute stress activating the p53/MDM2 loop via shifting MDM2 from negative to positive regulation of p53, to intensify p53 protein synthesis protected by ATM phosphorylation (Haronikova et al., 2019). As we assume in this research, underpinned with the up-regulation of DNA damage- & hypoxia-responsive genes, which were inherently p53-dependent genes (Corn & El-Deiry, 2007); DDB2, MDM2, CDKN1A, GADD45A, XPC, PGF, MXI, FAS, ATF3, and BAK (Table 1), plus uncovering TP53-derived DNA damage responding genes panel (Fig. 8). It is worth featuring that like p53, ATM kinase was not detected too. In other words, despite the different resulting predictive states of both signalings, they kept their constitutional transcriptional level, signifying that p53-exerted effects emerge from a proficient p53 translational level, not from minute p53 transcriptional level. Consistent with Sarin et al. findings of translation-dependent p53 activation (Sarin et al., 2017).
In this research, we have investigated the high-throughput transcriptomic profiling of NSCLC (A549) under intermittent hypoxia from a leading perspective concerning the emerged molecular alterations at the gene level and corresponding high-enriched pathways, due to the fact that oxygen deprivation characteristic affects the entire cancer genome and genetic instability. Therefore, further studies could deepen the interpretation and targeted exploitation.
Conclusion
Disclosing the dominant role of p53 signaling within intermittent hypoxic lung cancer (A549) by uncovering a 37-gene signature panel controlled essentially by TP53(p53). Distinguished by the activation of the p53-p21 axis of cell cycle down-regulation that transcended the role of the activated p53-apoptotic signalings, alongside p53-derived alterations to maintain the circumscribed metabolic pattern. Besides, hypoxia altered genome (replication and repair) response governing genetic instability that in turn mediates a remarkable EMT regulation of the hypo-proliferative hypoxic cancer cell (A549). As the final result, increase doxorubicin resistance in hypoxic-resistant lung cancer cells (A549).
Data availability
The datasets used or analyzed during the present research are available from the corresponding author on reasonable request.
References
AbuHammad, S., & Zihlif, M. (2013). Gene expression alterations in doxorubicin resistant MCF7 breast cancer cell line. Genomics, 101(4), 213–220. https://doi.org/10.1016/j.ygeno.2012.11.009
Alhawarat, F. M., Hammad, H. M., Hijjawi, M. S., Sharab, A. S., Abuarqoub, D. A., Shhab, M. A. A., & Zihlif, M. A. (2019). The effect of cycling hypoxia on MCF-7 cancer stem cells and the impact of their microenvironment on angiogenesis using human umbilical vein endothelial cells (HUVECs) as a model. PeerJ, 7, e5990. https://doi.org/10.7717/peerj.5990
Bayer, C., & Vaupel, P. (2012). Acute versus chronic hypoxia in tumors: Controversial data concerning time frames and biological consequences. Strahlentherapie Und Onkologie, 188(7), 616–627. https://doi.org/10.1007/s00066-012-0085-4
Bhaskara, V. K., Mohanam, I., Rao, J. S., & Mohanam, S. (2012). Intermittent hypoxia regulates stem-like characteristics and differentiation of neuroblastoma Cells. PLoS ONE, 7(2), e30905. https://doi.org/10.1371/journal.pone.0030905
Cairns, R. A., Kalliomaki, T., & Hill, R. P. (2001). Acute (cyclic) hypoxia enhances spontaneous metastasis of KHT murine tumors. Cancer Research, 61(24), 8903–8908.
Chan, C.Y.-K., Yuen, V.W.-H., & Wong, C.C.-L. (2019). Hypoxia and the metastatic niche. Advances in Experimental Medicine and Biology, 1136, 97–112. https://doi.org/10.1007/978-3-030-12734-3_7
Chen, C., Liang, Q.-Y., Chen, H.-K., Wu, P.-F., Feng, Z.-Y., Ma, X.-M., Wu, H.-R., & Zhou, G.-Q. (2018). DRAM1 regulates the migration and invasion of hepatoblastoma cells via autophagy-EMT pathway. Oncology Letters, 16(2), 2427–2433. https://doi.org/10.3892/ol.2018.8937
Chen, A., Sceneay, J., Gödde, N., Kinwel, T., Ham, S., Thompson, E. W., Humbert, P. O., & Möller, A. (2018). Intermittent hypoxia induces a metastatic phenotype in breast cancer. Oncogene, 37(31), 4214–4225. https://doi.org/10.1038/s41388-018-0259-3
Chenevier-Gobeaux, C., Simonneau, C., Lemarechal, H., Bonnefont-Rousselot, D., Poiraudeau, S., Rannou, F., Ekindjian, O. G., Anract, P., & Borderie, D. (2013). Effect of hypoxia/reoxygenation on the cytokine-induced production of nitric oxide and superoxide anion in cultured osteoarthritic synoviocytes. Osteoarthritis and Cartilage, 21(6), 874–881. https://doi.org/10.1016/j.joca.2013.03.010
Coppé, J.-P., Desprez, P.-Y., Krtolica, A., & Campisi, J. (2010). The senescence-associated secretory phenotype: The dark side of tumor suppression. Annual Review of Pathology: Mechanisms of Disease, 5(1), 99–118. https://doi.org/10.1146/annurev-pathol-121808-102144
Corn, P. G., & El-Deiry, W. S. (2007). Microarray analysis of p53-dependent gene expression in response to hypoxia and DNA damage. Cancer Biology & Therapy, 6(12), 1858–1866. https://doi.org/10.4161/cbt.6.12.5330
Di, G., Liu, Y., Lu, Y., Liu, J., Wu, C., & Duan, H.-F. (2014). IL-6 secreted from senescent mesenchymal stem cells promotes proliferation and migration of breast cancer cells. PLoS ONE, 9(11), e113572. https://doi.org/10.1371/journal.pone.0113572
Drosos, Y., Escobar, D., Chiang, M.-Y., Roys, K., Valentine, V., Valentine, M. B., Rehg, J. E., Sahai, V., Begley, L. A., Ye, J., Paul, L., McKinnon, P. J., & Sosa-Pineda, B. (2017). ATM-deficiency increases genomic instability and metastatic potential in a mouse model of pancreatic cancer. Scientific Reports, 7(1), 11144. https://doi.org/10.1038/s41598-017-11661-8
Du, Y., Zhou, Q., Yin, W., Zhou, L., Di, G., Shen, Z., Shao, Z., & Lu, J. (2011). The role of topoisomerase IIα in predicting sensitivity to anthracyclines in breast cancer patients: A meta-analysis of published literatures. Breast Cancer Research and Treatment, 129(3), 839–848. https://doi.org/10.1007/s10549-011-1694-9
Ferlay, J., Colombet, M., Soerjomataram, I., Parkin, D. M., Piñeros, M., Znaor, A., & Bray, F. (2021). Cancer statistics for the year 2020: An overview. International Journal of Cancer, 149(4), 778–789. https://doi.org/10.1002/ijc.33588
Greaves, W., Xiao, L., Sanchez-Espiridion, B., Kunkalla, K., Dave, K. S., Liang, C. S., Singh, R. R., Younes, A., Medeiros, L., & Vega, F. (2012). Detection of ABCC1 expression in classical Hodgkin lymphoma is associated with increased risk of treatment failure using standard chemotherapy protocols. Journal of Hematology & Oncology, 5(1), 47. https://doi.org/10.1186/1756-8722-5-47
Haronikova, L., Olivares-Illana, V., Wang, L., Karakostis, K., Chen, S., & Fåhraeus, R. (2019). The p53 mRNA: An integral part of the cellular stress response. Nucleic Acids Research, 47(7), 3257–3271. https://doi.org/10.1093/nar/gkz124
Harris, A. L. (2002). Hypoxia—A key regulatory factor in tumour growth. Nature Reviews Cancer, 2(1), 38–47. https://doi.org/10.1038/nrc704
Herbst, R. S., Heymach, J. V., & Lippman, S. M. (2008). Lung cancer. The New England Journal of Medicine, 359(13), 1367–1380. https://doi.org/10.1056/NEJMra0802714
Jänicke, R. U., Sohn, D., & Schulze-Osthoff, K. (2008). The dark side of a tumor suppressor: Anti-apoptotic p53. Cell Death and Differentiation, 15(6), 959–976. https://doi.org/10.1038/cdd.2008.33
Jarrar, Y., Zihlif, M., Al Bawab, A. Q., & Sharab, A. (2020). Effects of intermittent hypoxia on expression of glucose metabolism genes in MCF7 breast cancer cell line. Current Cancer Drug Targets, 20(3), 216–222. https://doi.org/10.2174/1568009619666191116095847
Jat, P., Perkins, N., & Mowla, S. (2013). Friend or foe: Emerging role of nuclear factor kappa-light-chain-enhancer of activated B cells in cell senescence. OncoTargets and Therapy. https://doi.org/10.2147/OTT.S36160
Jiang, H., Reinhardt, H. C., Bartkova, J., Tommiska, J., Blomqvist, C., Nevanlinna, H., Bartek, J., Yaffe, M. B., & Hemann, M. T. (2009). The combined status of ATM and p53 link tumor development with therapeutic response. Genes & Development, 23(16), 1895–1909. https://doi.org/10.1101/gad.1815309
Jin, M. H., & Oh, D.-Y. (2019). ATM in DNA repair in cancer. Pharmacology & Therapeutics, 203, 107391. https://doi.org/10.1016/j.pharmthera.2019.07.002
Liu, Y., Song, X., Wang, X., Wei, L., Liu, X., Yuan, S., & Lv, L. (2010). Effect of chronic intermittent hypoxia on biological behavior and hypoxia-associated gene expression in lung cancer cells. Journal of Cellular Biochemistry, 111(3), 554–563. https://doi.org/10.1002/jcb.22739
Mavrogonatou, E., Pratsinis, H., & Kletsas, D. (2020). The role of senescence in cancer development. Seminars in Cancer Biology, 62, 182–191. https://doi.org/10.1016/j.semcancer.2019.06.018
Mittal, V., El Rayes, T., Narula, N., McGraw, T. E., Altorki, N. K., & Barcellos-Hoff, M. H. (2016). The microenvironment of lung cancer and therapeutic implications. Advances in Experimental Medicine and Biology, 890, 75–110. https://doi.org/10.1007/978-3-319-24932-2_5
Muz, B., de la Puente, P., Azab, F., & Azab, A. K. (2015). The role of hypoxia in cancer progression, angiogenesis, metastasis, and resistance to therapy. Hypoxia (auckland, NZ), 3, 83–92. https://doi.org/10.2147/HP.S93413
Olbryt, M., Habryka, A., Student, S., Jarząb, M., Tyszkiewicz, T., & Lisowska, K. M. (2014). Global gene expression profiling in three tumor cell lines subjected to experimental cycling and chronic hypoxia. PLoS ONE, 9(8), e105104. https://doi.org/10.1371/journal.pone.0105104
Peinado, H., Olmeda, D., & Cano, A. (2007). Snail, Zeb and bHLH factors in tumour progression: An alliance against the epithelial phenotype? Nature Reviews. Cancer, 7(6), 415–428. https://doi.org/10.1038/nrc2131
Popper, H. H. (2016). Progression and metastasis of lung cancer. Cancer Metastasis Reviews, 35(1), 75–91. https://doi.org/10.1007/s10555-016-9618-0
Rodriguez-Canales, J., Parra-Cuentas, E., & Wistuba, I. I. (2016). Diagnosis and molecular classification of lung cancer. Cancer Treatment and Research, 170, 25–46. https://doi.org/10.1007/978-3-319-40389-2_2
Roh, Y.-G., Mun, M.-H., Jeong, M.-S., Kim, W.-T., Lee, S.-R., Chung, J.-W., Kim, S. I., Kim, T. N., Nam, J. K., & Leem, S.-H. (2018). Drug resistance of bladder cancer cells through activation of ABCG2 by FOXM1. BMB Reports, 51(2), 98–103. https://doi.org/10.5483/bmbrep.2018.51.2.222
Salem, A., Asselin, M.-C., Reymen, B., Jackson, A., Lambin, P., West, C. M. L., O’Connor, J. P. B., & Faivre-Finn, C. (2018). Targeting hypoxia to improve non-small cell lung cancer outcome. Journal of the National Cancer Institute. https://doi.org/10.1093/jnci/djx160
Sarin, N., Engel, F., Kalayda, G. V., Mannewitz, M., Cinatl, J., Rothweiler, F., Michaelis, M., Saafan, H., Ritter, C. A., Jaehde, U., & Frötschl, R. (2017). Cisplatin resistance in non-small cell lung cancer cells is associated with an abrogation of cisplatin-induced G2/M cell cycle arrest. PLoS ONE, 12(7), e0181081. https://doi.org/10.1371/journal.pone.0181081
Sermeus, A., & Michiels, C. (2011). Reciprocal influence of the p53 and the hypoxic pathways. Cell Death & Disease, 2(5), e164–e164. https://doi.org/10.1038/cddis.2011.48
Verduzco, D., Lloyd, M., Xu, L., Ibrahim-Hashim, A., Balagurunathan, Y., Gatenby, R. A., & Gillies, R. J. (2015). Intermittent hypoxia selects for genotypes and phenotypes that increase survival, invasion, and therapy resistance. PLoS ONE, 10(3), e0120958. https://doi.org/10.1371/journal.pone.0120958
Vogelstein, B., Lane, D., & Levine, A. J. (2000). Surfing the p53 network. Nature, 408(6810), 307–310. https://doi.org/10.1038/35042675
Wang, C., Chen, F., Liu, Y., Xu, Q., Guo, L., Zhang, X., Ruan, Y., Shi, Y., Shen, L., Li, M., Du, H., Sun, X., Ma, J., He, L., & Qin, S. (2018). Genetic association of drug response to erlotinib in chinese advanced non-small cell lung cancer patients. Frontiers in Pharmacology, 9, 360. https://doi.org/10.3389/fphar.2018.00360
Wei, Z., Guo, H., Qin, J., Lu, S., Liu, Q., Zhang, X., Zou, Y., Gong, Y., & Shao, C. (2019). Pan-senescence transcriptome analysis identified RRAD as a marker and negative regulator of cellular senescence. Free Radical Biology & Medicine, 130, 267–277. https://doi.org/10.1016/j.freeradbiomed.2018.10.457
Wu, F., Li, J., Jang, C., Wang, J., & Xiong, J. (2014). The role of Axl in drug resistance and epithelial-to-mesenchymal transition of non-small cell lung carcinoma. International Journal of Clinical and Experimental Pathology, 7(10), 6653–6661.
Yousaf, M., & Ali, M. (2020). Modulation of ABCG2 surface expression by Rab5 and Rab21 to overcome multidrug resistance in cancer cells. Xenobiotica, 50(8), 988–996. https://doi.org/10.1080/00498254.2020.1716107
Zhang, X., Qin, Z., & Wang, J. (2010). The role of p53 in cell metabolism. Acta Pharmacologica Sinica, 31(9), 1208–1212. https://doi.org/10.1038/aps.2010.151
Acknowledgements
This research was supported by a grant from the Deanship of Academic Research at The University of Jordan. All of this research was accomplished appreciatively in the Department of Pharmacology, School of Medicine at The University of Jordan.
Funding
This research was funded by the Deanship of Academic Research at The University of Jordan.
Author information
Authors and Affiliations
Department of Pharmacology, School of Medicine, The University of Jordan, Amman, Jordan
Lina M. Al-Najjar & Malek Zihlif
College of Pharmacy, Al-Zaytoonah University of Jordan, Amman, Jordan
Yazun Jarrar
Corresponding author
Correspondence to Lina M. Al-Najjar.
Ethics declarations
Conflict of interest
The authors declare there is no conflict of interest.
Ethical approval
Not applicable.
Consent for publication
All the authors have read the final version of the manuscript and consent to the publication.
Supplementary Information
Below is the link to the electronic supplementary material.
Supplementary file1 (PDF 335 KB)
Supplementary file2 (PDF 79 KB)
Supplementary file3 (PDF 56 KB)
Supplementary file4 (PDF 576 KB)
Supplementary file5 (PDF 130 KB)
Rights and permissions
About this article
Cite this article
Al-Najjar, L.M., Zihlif, M. & Jarrar, Y. Differential molecular alterations promoting non-small cell lung cancer under hypoxia. GENOME INSTAB. DIS. 3, 108–121 (2022). https://doi.org/10.1007/s42764-022-00062-5
Received03 November 2021
Revised22 January 2022
Accepted27 January 2022
Published21 March 2022
Issue DateApril 2022
DOIhttps://doi.org/10.1007/s42764-022-00062-5
Share this article
Anyone you share the following link with will be able to read this content:
Get shareable linkKeywords
Molecular alterations
Non-small cell lung cancer (NSCLC)
Hypoxia
TP53 (p53)
CDKN1A (p21)
Doxorubicin
用户登录
还没有账号?
立即注册