G-quadruplex and 8-oxo-7,8-dihydroguanine across the genome: methodologies and crosstalk
Review Article
Genome Instability & Disease 3, 241–254 (2022)
Abstract
G-quadruplex (G4) is a non-canonical DNA second structure formed on specific G-rich sequences which are enriched in transcriptional regulatory regions and telomeres. This structure is involved in multiple cellular processes including transcription regulation and genome integrity. On the other hand, G-rich regions are hotspots of oxidative damage, since G has the lowest redox potential among the four nucleobases, and the 5’G of a G stretch has an even lower ionization potential. Evidence emerged recently that the most common oxidative damage, 8-oxo-7,8-dihydroguanine (OG), plays an epigenetic-like role to regulate transcription. Therefore, G4 and OG may co-localize at G-rich regions and interact with each other to regulate transcription. In this review, we summarize recent advantages about genome-wide mapping of G4 and OG, and discuss their crosstalk at genomic level.
Introduction
Human genome consists of four nucleotides, namely A, T, C, and G, which form formal Watson–Crick base pairing between A:T and C:G, respectively (Watson & Crick, 1953). The average GC content of the human genome is about 40.4%; however, GC is not uniformly distributed across the genome (Schneider et al., 2017). Indeed, GC is highly enriched in transcriptional regulatory regions, such as promoters and the 5’-untranslated regions (5’-UTR), as well as telomeres that have the “TTAGGG” repeats (Balagurumoorthy & Brahmachari, 1994; Zhang et al., 2004).
Of note, these G-rich regions have two unique properties. First, four Gs can form a square planar structure named G-tetrad through Hoogsteen hydrogen bonding, and three G-tetrads can stack to form a non-canonical DNA secondary structure called G-quadruplex (G4) (Fig. 1a) (Brooks et al., 2010; Huppert, 2010; Kwok & Merrick, 2017). Due to the relative direction of G stretches (parallel, anti-parallel, or hybrid), G4s can be formed in three conformations (Burge et al., 2006; Spiegel et al., 2020). Specific G-rich sequences having the potential to form G4 structure are known as potential quadruplex sequences (PQSs), which usually contain at least four stretches of three or more Gs (Huppert & Balasubramanian, 2005; Kwok & Merrick, 2017; Todd et al., 2005). Not surprisingly, PQSs are enriched in the GC-rich transcriptional regulatory regions and telomeres (Fleming et al., 2018; Sen & Gilbert, 1988; Xu, 2011). As a competitor of the canonical B-form double-stranded DNA, G4 is involved in multiple processes including transcription regulation, DNA replication, and genome integrity (Bryan, 2019; Cogoi & Xodo, 2006; Hansel-Hertsch et al., 2017; Rhodes & Lipps, 2015; Varshney et al., 2020). The biological roles of G4 are complicated in these processes. For transcription regulation, G4s in promoters could either inhibit transcription by blocking the transcription machinery or enhance transcription by separating two strands to facilitate the loading of transcription factors (Bochman et al., 2012). G4 can also directly recruit transcription factors (e.g., Sp1 and MAZ) and other G4-binding proteins (e.g., nucleolin and POT1) (Cogoi et al., 2014; Kwok & Merrick, 2017; Piekna-Przybylska et al., 2014; Ray et al., 2014; Santos et al., 2022) to regulate transcription. Whether promoting or suppressing transcription depends on the specific position and strand of the G4 structure. In vivo evidence of the transcription regulation role of G4 came from the observations that G-quadruplex stabilizing ligands could change the expression of many genes (e.g., c-MYC) whose promoters were enriched for PQSs (Bochman et al., 2012; Siddiqui-Jain et al., 2002).
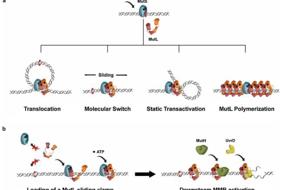
Fig. 1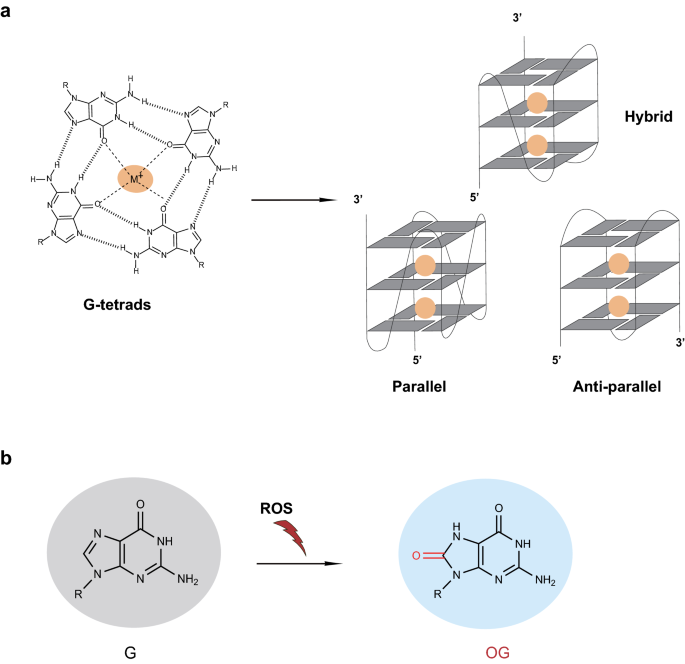
Chemical structures of OGs and G4s. a The formation of OG by reactive oxygen species (ROS) attacking. b Structures of G-quartet and G4s. G-quartet is constituted of four Hoogsteen hydrogen-bonded guanines and central cation (colored yellow) coordinated to oxygen atoms, while G4s are formed by the stacking of three G-quartets, and are divided into three conformations (parallel, anti-parallel, and hybrid) based on the strand direction
Full size imageG4 also plays important roles in DNA replication and telomere maintenance (Rhodes & Lipps, 2015). It can inhibit DNA polymerase and telomerase, and thus need to be resolved by DNA helicases, including WRN, BLM, FANCJ, and PIF1 during replication (Huber et al., 2002; Mohaghegh et al., 2001; Sanders, 2010; Sarkies et al., 2012). Lack of these enzymes results in replication pressure, telomere dysfunction, accumulation of DNA damage, and finally genome instability (Brosh, 2013; Rhodes & Lipps, 2015). On the other hand, G4 is associated with DNA replication origins, and is actually required for replication initiation in vertebrate cells (Valton et al., 2014). Moreover, G4 formed at telomeres can help telomere organization through G4-binding proteins, and protect telomeres from nuclease digestion (Bochman et al., 2012). Thus, G4 is a double-edged sword for genome integrity.
Another unique property of G-rich regions is that G has the lowest redox potential among the four nucleobases, and the 5’G of a G stretch has an even lower ionization potential due to π-stacking (Genereux & Barton, 2010; Schuster, 2000; Sugiyama & Saito, 1996). Therefore, G-rich regions should be more readily oxidized. There are various G oxidation products, including two-electron oxidation products like OG (8-oxo-7,8-dihydroguanine) (Fig. 1b) and 2Ih (5-carboxamido-5-formamido-2-iminohydan-toin), and four-electron oxidation products, such as Gh (5-guanidinohydantoin), Sp (spiroiminodihydantoin) and Z (2,2,4-triamino-2H-oxazol-5-one) (Cadet et al., 2010; Delaney et al., 2012; Neeley & Essigmann, 2006; Pratviel & Meunier, 2006). Among them, OG is the most abundant and well-studied lesion (Cadet et al., 2017; Kasai, 1997; Steenken & Jovanovic, 1997). Intriguingly, OG has an even lower redox potential than the undamaged G (Steenken et al., 2000; Xue & Greenberg, 2007), and thus is easy to be further oxidized to Gh and Sp (Luo et al., 2001; Niles et al., 2001). As the most common oxidative DNA damage (Cadet et al., 2003; Steenken & Jovanovic, 1997), OG can cause misincorporation of dA on the opposite position during replication, thus may induce G to T mutation (Shibutani et al., 1991), and finally result in cancers, neurological diseases, and aging (Lodato et al., 2018; Yu et al., 2016). To avoid these deleterious consequences, OGs and the misincorporated dAs are cleared through OGG1 (8-Oxoguanine DNA Glycosylase) and MUTYH (MutY DNA Glycosylase) glycosylases in human cells, respectively, leaving apurinic sites (AP sites) which are further handled by the base excision repair pathway (Dizdaroglu et al., 2017; Gorini et al., 2021). Mutations in these repair genes will increase the risk of multiple cancers (Sakamoto et al., 2007; Xie et al., 2004). Noteworthy, the repair intermediates of OG, i.e., AP sites and single-strand DNA breaks (SSBs), are more deleterious to genome stability, since they can block DNA polymerase and be converted to double-strand DNA breaks (DSBs) during DNA replication (Gorini et al., 2021).
Although OG is a common DNA damage, it was reported that OG also plays an epigenetic-like role to regulate gene transcription through a couple of possible mechanisms [reviewed in (Fleming & Burrows, 2020)]. For instance, OGs at the promoter of estrogen-responsive genes can recruit OGG1 and topoisomerase IIβ to activate downstream transcription (Perillo et al., 2008). Another example is that an inactive form of OGG1 (OGG1ox) which has an oxidized cysteine residue would retain at the OG sites and recruite NF-κB to trigger gene expression during inflammation (Pan et al., 2016). Intriguingly, the repair intermedia of OG (i.e., AP sites) can stabilize G4 structure and regulate transcription (Fleming et al., 2017; Roychoudhury et al., 2020), which will be discussed below.
Since both G4 and OG are able to regulate gene transcription and they have crosstalk with each other in vitro (Cadet et al., 2017; Fleming & Burrows, 2020; Huppert, 2010), it is intriguing whether they co-localize in the human genome and how they affect each other in the chromatin environment. In recent years, a couple of high-throughput sequencing-based techniques were developed to detect the genomic distribution of G4s (Chambers et al., 2015; Hansel-Hertsch et al., 2016; Marsico et al., 2019; Tu et al., 2021; Zheng et al., 2020) and OGs (Amente et al., 2019; An et al., 2021; Ding et al., 2017; Fang & Zou, 2020; Poetsch et al., 2018; Wu et al., 2018), shedding light on above questions.
Methods to measure genomic distribution of G4s
The positions of G4s in the genome are important for their biological roles (Bryan, 2019; Hansel-Hertsch et al., 2017; Rhodes & Lipps, 2015; Varshney et al., 2020); however, it is challenging to determine the existence and locations of G4s. On one hand, as a non-canonical structure, G4 is quite dynamic and always competing with the regular double-strand structure (Maizels, 2006; Spiegel et al., 2020). An important factor determining the balance between G4 and dsDNA is the type and concentration of monovalent cations (Sen & Gilbert, 1990). The G4 structure is stable in the presence of a low concentration of K+ or a higher concentration of Na+, while becoming unstable with Li+ (Gray & Chaires, 2008; Hud et al., 1996; Sen & Gilbert, 1990). Moreover, protein chaperones and helicases also impact the balance between G4 and dsDNA in vivo (Fang & Cech, 1993; Lerner & Sale, 2019; Rhodes & Lipps, 2015; Sauer & Paeschke, 2017). Therefore, the existence of G4 structure may change when extracting genomic DNA from cells. On the other hand, G4 is topologically polymorphic and can arise from the intra- or inter-molecular folding of various G-rich sequences (Burge et al., 2006; Patel et al., 2007; Rhodes & Lipps, 2015). This property causes two technical challenges. First, it is difficult to identify all possible sequences with the ability to form quadruplexes by theoretical analysis (Huppert & Balasubramanian, 2005; Kwok & Merrick, 2017). Second, the G4-specific antibodies cannot recognize all kinds of G4 structures (Kwok & Merrick, 2017). Nonetheless, a couple of high-throughput sequencing technology-based methods emerged in recent years to detect the genomic distribution of G4s both in vitro and in vivo (Fig. 2) (Chambers et al., 2015; Hansel-Hertsch et al., 2016; Marsico et al., 2019; Tu et al., 2021; Zheng et al., 2020).
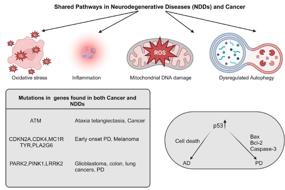
Fig. 2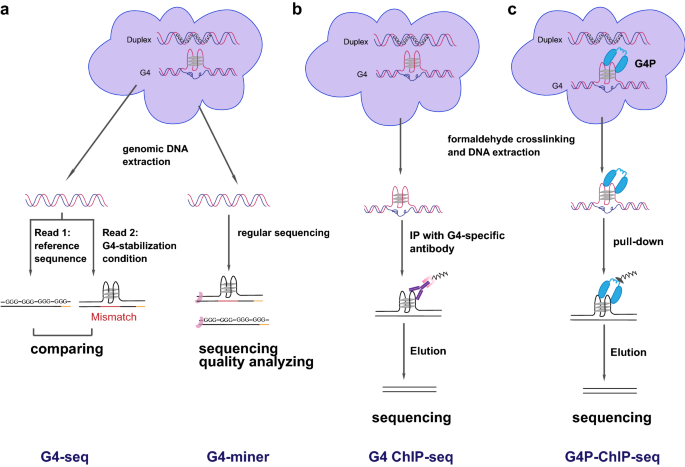
Illustration of high-throughput sequencing-based methods for measuring G4s. a G4-seq and G4-miner detect G4s in extracted genomic DNA based on the interference of G4 on DNA replication. b G4 ChIP-seq measures in vivo G4s by immunoprecipitation with a G4-antibody after crosslinking. c G4P-ChIP-seq captures G4s in situ by expressing an artificial G4-probe protein (G4P) and enriches G4-containing fragments by pull-down G4P after crosslinking
Full size imageThe first breakthrough of genome-wide G4 mapping is G4-seq (Chambers et al., 2015; Marsico et al., 2019) which detects the polymerase stalling caused by G4 (Rhodes & Lipps, 2015; Weitzmann et al., 1996) with the Illumina sequencing platform (Fig. 2a, left). In the G4-seq procedure, the genomic DNA sequencing library is first sequenced in the buffer containing Na + or Li + which is suitable for dsDNA formation (Hud et al., 1996) and enables detection of the actual sequence. The same library is then sequenced again in the buffer with K + and/or the G4-stabilizing ligand pyridostatin (PDS) (Rodriguez et al., 2008) which can promote the formation and stabilization of G4 and induce polymerase stalling. By comparing the differences in sequencing quality and mismatches between two runs, G4-seq can elucidate the distribution of in vitro G4s. G4-seq was applied to 12 species including human beings, and showed that the proportion of canonical PQS (G≥3N1–7G≥3N1–7G≥3N1–7G≥3) (Huppert & Balasubramanian, 2005; Todd et al., 2005) in OG4 (observed G4 sequence) was > 70% for 10 out of 12 species, and > 50% for the other two. The remaining OG4s are non-canonical PQSs, e.g., those with long (> 7) intervals between G-tracks and/or a discontinuity in the G-tracks leading to bulges (Chambers et al., 2015; Guedin et al., 2010; Mukundan & Phan, 2013). Moreover, this study revealed that the strong enrichment of OG4s in gene promoter regions and 5’UTRs was particular to mammals among the 12 species, with human having the strongest enrichment. Of note, OG4s in human were closely associated with regulatory regions of cancer-related genes and somatic copy-number variations. Although G4-seq is a powerful approach for identifying all possible G4 sites in genomic DNA, especially various non-canonical G4 structures that are difficult to be predicted (Huppert & Balasubramanian, 2005), it still has some limitations. First, G4-seq detected G4s in vitro, which reflects the potential of particular sequences to form G4s under specific conditions instead of actual G4 structures in vivo. Second, G4-seq is inevitably biased due to the sequence mismatch analysis, and its resolution is not enough to disentangle G4s in close proximity (Marsico et al., 2019). Finally, G4-seq requires specific sequencing buffers that are not readily available, as well as the cost of two sequencing runs.
Another similar method, G4-miner (Tu et al., 2021), is indeed a bioinformatic tool to identify G4 structure from regular whole-genome sequencing data (Fig. 2a, right). The presence of G4 can cause unexpected local fluctuations of sequencing quality (Rhodes & Lipps, 2015; Weitzmann et al., 1996), which are captured by G4-miner. Therefore, G4-miner is a convenient method that needs no specific reagents or operations. Similar to G4-seq, G4-miner detected in vitro G4 structures. Furthermore, since there is no extra G4 stabilization step, G4-miner requires a high sequencing depth and cannot completely exclude the influence of other DNA secondary structures. With this method, Tu et al. identified 45.9% of all PG4s (predicted canonical G4-forming sequences) in genomic DNA from GM12878 human lymphoblast, and found a strong enrichment of OG4s in 5’-UTRs and splicing junctions in the human genome (Tu et al., 2021). Moreover, compared to G4-seq, G4-miner preferred to detect non-canonical G4s, especially two quartets (GGNxGGNxGGNxGG).
To capture in vivo G4 structures, a fixing step before DNA extraction is usually required. According to this idea, Hansel-Hertsch et al. adapted the antibody-based chromatin immunoprecipitation followed by the next-generation sequencing (ChIP-seq) approach for G4 mapping, namely G4 ChIP-seq (Hansel-Hertsch et al., 2016, 2018) (Fig. 2b). In brief, after formaldehyde crosslinking, DNA is fragmented and subjected to immunoprecipitation (IP) with an antibody (BG4) specific to G4 structures (Biffi et al., 2013) for the enrichment and subsequent sequencing. This method identified about 10,000 G4 peaks from the human genome, predominantly in nucleosome-depleted regulatory regions. Consistent with the conclusion from G4-seq, these OG4s are enriched in the promoters and 5’UTRs of highly transcribed genes, particularly cancer-related genes, as well as in regions with somatic copy-number amplifications. In contrast to G4-seq, G4 ChIP-seq detects in vivo G4s within a chromatin context. Thus, the fact that G4 ChIP-seq detected fewer OG4s than G4-seq implies a general inhibitory effect of heterochromatin on G4 formation. Moreover, the number and distribution of G4 peaks are quite different between HaCaT and NHEK cells, further suggesting the impacts of chromatin environment and other cellular factors on in vivo G4 formation (Hansel-Hertsch et al., 2016). However, G4 ChIP-seq depends on specific antibodies which may introduce nonspecific binding and biases, while cellular G4-binding proteins can interfere with binding of antibodies. In addition, since IP of G4 is carried out with isolated and segmented DNA, incidental G4 formation after DNA extraction cannot be ruled out. G4 antibodies other than BG4 were also used for G4 ChIP-seq and obtained similar results (Lam et al., 2013; Liu et al., 2016). Recently, the CUT&TAG technique was adopted to replace traditional ChIP-seq and enabled G4 detection in fewer cells with higher sensitivity (Hui et al., 2022; Li et al., 2021; Lyu et al., 2022).
To capture G4s under native conditions, Zheng et al. developed G4P-ChIP-seq method (Zheng et al., 2020) (Fig. 2c). In this assay, a small (6.7 kDa) artificial protein “G4 probe” (G4P) with high affinity and specificity to G4 structure was expressed in cells to bind G4s in vivo. After formaldehyde crosslinking, genomic G4s were determined by ChIP-seq targeting the epitope-tagged G4P protein (Zheng et al., 2020). Compared with BG4 and other G4 antibodies, G4P has a higher affinity to various G4 structures and less nonspecific binding, and the smaller size of G4P can reduce the steric hindrance to access G4s. More importantly, G4P binds to G4s in vivo, thus excluding incidental G4 formation after DNA extraction. G4P-ChIP-seq identified more than 123,000 G4P peaks in A549 cells, and the ratio of PQS-positive peaks was much higher than that in G4 ChIP-seq (89% vs 25%). The resolution and sensitivity of G4P-ChIP-seq were also obviously improved in comparison to G4 ChIP-seq. Similar to G4 ChIP-seq, the pattern of G4 distribution varied among different cell lines. Furthermore, G4P-ChIP-seq also identified gene promoters as hot spots of G4s, in accordance with other studies (Chambers et al., 2015; Hansel-Hertsch et al., 2016; Tu et al., 2021). However, the expression of G4P in cells might influence the stability of G4s and indirectly affect transcription, leading to artificial results.
In summary, it can be concluded that G4s are highly enriched in promoter regions of the human genome, consistent with the regulatory role of G4 in gene expression (Hansel-Hertsch et al., 2017; Rhodes & Lipps, 2015). However, all current methods for G4 mapping are far from perfect. None of these methods can faithfully capture all G4s under physiological conditions, nor assign a detected G4 peak to a specific PQS. Moreover, computational prediction of G4s is widely used; however, current algorithms are based on available experimental data from the above methods (Bedrat et al., 2016; Hon et al., 2017; Sahakyan et al., 2017; Xiao et al., 2014). Thus, better G4 sequencing methods as well as new bioinformatic tools and improved computational prediction algorithms are required for studying the biological functions of G4.
Methods to map OG across the genome
Although OG is the most common oxidative damage, the steady-state level of cellular OG is estimated to be as low as ~ 0.5–1 lesion per 106 nucleotides (nt) in human cells (European Standards Committee on Oxidative, 2003; Ravanat et al., 2002; Gedik et al., 2005), since it is controlled by the dynamic balance between formation and repair. These OGs are not uniformly distributed throughout the genome, and the genomic distribution is important for their negative and positive roles in human cells. Some early studies revealed the heterogeneous distributions of OGs (Ohno et al., 2006; Yoshihara et al., 2014); however, these methods could not detect the accurate sites of OGs. Noteworthy, there are several obstacles to OG sequencing. First, as mentioned above, OGs are rare in cellular DNA under physiological conditions (European Standards Committee on Oxidative, 2003; Ravanat et al., 2002), and their occurrence is relatively random. Therefore, it is challenging to distinguish OGs from bulky normal DNA. Moreover, a mass of artificial OG would be produced during sample processing, such as DNA purification, sonication, and enzymatic reaction. The incidental oxidation could greatly compromise the accuracy of OG measurement, albeit the addition of anti-oxidation agents can reduce this effect (European Standards Committee on Oxidative, 2003; Mangal et al., 2009; Badouard et al., 2008). Nevertheless, a couple of new methods were developed for OG sequencing in recent years. These methods took use of different strategies for OG capturing, involving an antibody recognizing OGs, specific glycosylases, and OG-selective chemical reaction (Fig. 3) (Amente et al., 2019; An et al., 2021; Ding et al., 2017; Fang & Zou, 2020; Poetsch et al., 2018; Wu et al., 2018).
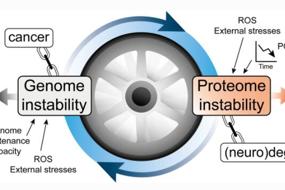
Fig. 3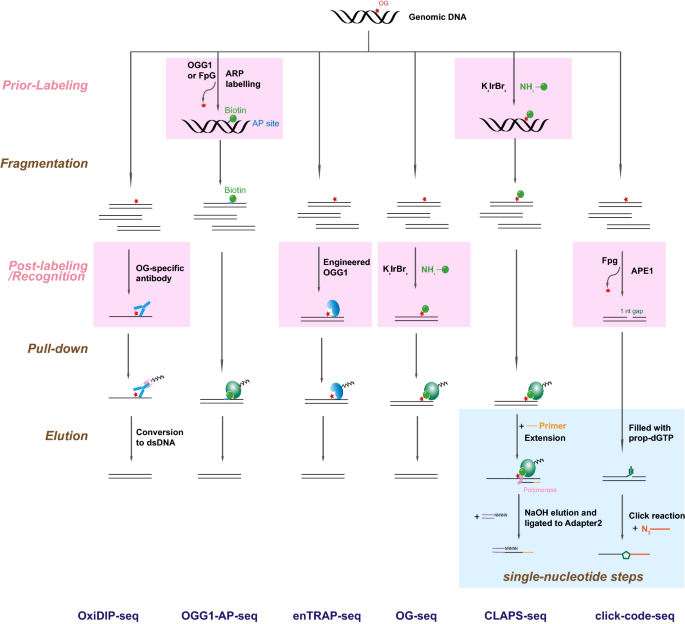
Illustration of high-throughput sequencing-based methods for measuring OGs. These methods are different in damage recognition/labeling strategies and procedure designs. In general, OGs are recognized or labeled by an OG-antibody, specific enzymes recognizing OG (OGG1 or FpG), or a selective chemical reaction. Regarding to procedure design, except OG-AP-seq and CLAPS-seq which label OGs prior to sonication, other methods all recognize or label OGs after DNA fragmentation. In addition, CLAPS-seq and click-code-seq have extra steps to achieve single-nucleotide resolution
Full size imageThe strategy of immunoprecipitation with an anti-OG-antibody was utilized by OxiDIP-seq to enrich OG-containing fragments from sonicated genomic DNA (Amente et al., 2019; Gorini et al., 2020; Scala et al., 2022) (Fig. 3, “OxiDIP-seq”). This method identified tens of thousands of OG hotspots from the human genome and revealed that OGs co-localize with DNA replication origins within the body of long genes. Moreover, it also found that genes within Common Fragile Sites (CFSs), as well as a set of super-enhancers associated with fragile CTCF-mediated chromatin loops, show high levels of OG. However, due to the limitation of antibody IP strategy (Mitchell et al., 2002; Serrano et al., 1996), this method just reached a resolution of several hundred base pairs, and nonspecific binding is unavoidable. Remarkably, sonication and denaturation were required prior to IP, which would produce a substantial amount of artificial OGs and compromise the results (European Standards Committee on Oxidative, 2003; Mangal et al., 2009; Badouard et al., 2008).
OG-specific glycosidases, i.e., OGG1 and FpG (Boiteux et al., 2017), are used for OG recognition in a couple of methods (Gilat et al., 2021; Jin et al., 2022; Poetsch et al., 2018; Wu et al., 2018). Among them, click-code-seq used FpG together with APE1 to remove OGs in sonicated genomic DNA and created single-nucleotide gaps, which were filled by the propargyl-modified guanine (Wu et al., 2018) (Fig. 3, “click-code-seq”). Then an azido-modified code sequence was added through a Click reaction for sequencing. This method was the first one to achieve single-base resolution, and verified that OGs were enriched at the 5’ G of GG dinucleotide, in accordance with the theoretical calculation (Genereux & Barton, 2010; Schuster, 2000). It revealed that there were fewer OGs in transcription start sites (TSSs), DNase I hypersensitive sites (DHSs), and autonomously replicating sequences (ARSs), while higher OG enrichment appeared at telomeres, nucleosomes, and positions of low RNA pol II occupancy. However, the specificity of click-code-seq was challenged by the relatively wide substrate spectrum of FpG (David & Wiliams, 1998; Krishnamurthy et al., 2008), and depended on the efficiency of prior blocking of pre-existing AP sites and free 3’ hydroxyl groups. This method was only applied to yeast till now. Similar to OxiDIP-seq, artificial OGs would be generated by sonication and could not be distinguished by this method.
Another method, OGG1-AP-seq, utilized OGG1 to convert OGs to AP sites, which were then labeled with biotin by the aldehyde reactive probe (ARP) (Poetsch et al., 2018) (Fig. 3, “OGG1-AP-seq”). Genomic DNA was sonicated after labeling, and biotinylated fragments were pulled down with streptavidin beads for sequencing. Therefore, sonication-produced OGs would not interfere with the final results. Like OxiDIP-seq, the resolution of OGG1-AP-seq was hundreds of base pairs. OGG1-AP-seq identified fewer OGs at promoters, exons, and transcription termination sites. Likewise, other sequencing methods for AP sites or free 3’ hydroxyl groups, e.g., snAP-seq (Liu et al., 2019), Endo-seq (Ding et al., 2015), Nick-seq (Cao et al., 2020), and circle-damage-seq (Jin et al., 2022), can also be or have already been used for OG mapping with the help of OG-specific glycosidases (and APE1 for the latter three). These methods could reach single-nucleotide resolution; however, the nonspecific activity of the enzymes and pre-existing AP sites and/or free 3’ hydroxyl groups would influence the specificity of these methods.
Unlike the above methods, enTRAP-seq made use of an engineered OGG1 which removed the oxidized base and formed a covalent bond with the repair intermediate to “trap” OGs (Fang & Zou, 2020) (Fig. 3, “enTRAP-seq”). This method had a resolution of hundreds of base pairs, and only identified ~ 1500 FpG-sensitive OG peaks from the mouse genome. Of note, this method used nucleases to perform DNA fragmentation, and thus should produce fewer OGs than sonication (Costello et al., 2013). However, the specificity and efficiency of the engineered OGG1 might not be satisfactory, since only a small fraction of the identified peaks were sensitive to FpG-treatment. This study concluded that OG peaks were significantly enriched in open chromatin regions and slightly decreased in closed heterochromatin regions. This conclusion was contrary to OGG1-AP-seq (Poetsch et al., 2018) and click-code-seq (Wu et al., 2018). In addition, it reported that more than 80% of OG peaks possessed PQSs, and OG peaks frequently occurred in regulatory elements such as promoter and 5’UTR, consistent with the results of OG-seq (see below) (Ding et al., 2017) and OxiDIP-seq (Amente et al., 2019).
OGs can also be labeled by a selective oxidation reaction due to their lower redox potential than G and other bases (Steenken et al., 2000; Xue & Greenberg, 2007). OG-seq took advantage of this reaction and labeled OGs with biotin for subsequent purification and sequencing (Ding et al., 2017) (Fig. 3, “OG-seq”). However, it had the same issue of artificial OGs as genomic DNA was sonicated before the labeling reaction, and possessed a resolution of several hundred base pairs. This method identified ~ 10,000 OG-enriched regions in WT mouse cells and ~ 18,000 in Ogg1−/− mouse cells. This study reported that promotors and UTRs had more OG-enriched sites; however, reanalyses of OG-seq data by other groups lead to different conclusions (Gorini et al., 2020; Poetsch et al., 2018).
CLAPS-seq (Chemical Labeling And Polymerase Stalling Sequencing) was a single-nucleotide resolution OG sequencing method based on above chemical labeling reaction (An et al., 2021) (Fig. 3, “CLAPS-seq”). In contrast to OG-seq, CLAPS-seq carried out the chemical labeling reaction before sonication to minimize incidental oxidation. After sonication, end-repair and adaptor ligation, a primer extension reaction was performed with a high-fidelity DNA polymerase to determine the exact position of OGs, since the polymerase could be blocked by biotin-labeled OGs. The extension products were ligated to the second adaptor and sequenced. The specificity of this method was confirmed by the high ratio of G residues (≥ 70%) at sequenced damage sites for both endogenous and exogenous OGs in human cells. It is worth noting that the first base resolution OG sequencing method, click-code-seq, incorporated a modified G base to enzyme-generated single-nucleotide gaps (Wu et al., 2018), and thus, the ratio of G at sequenced damage sites could not reflect the specificity of this method. Consistent with click-code-seq, CLAPS-seq revealed the enrichment of OGs at the 5’G of GG, as well as relative lower OG level in promoter regions which have the highest GC ratio in the human genome. Further analysis showed that the reduced occurrence of OGs at promoters is, at least partly, due to the reduction of OGs at G4s, whereas non-G4-PQSs are hot spots of OGs (An et al., 2021).
Moreover, single-molecular sequencing technologies, or the third-generation sequencing, have the potential to directly identify DNA modifications. Two major routes of the third-generation sequencing, namely single-molecule sequencing in real time (SMRT) and nanopore sequencing, are both used to detect OGs at base resolution, either directly or after labeling (An et al., 2015; Schadt et al., 2013; Zatopek et al., 2019). However, these methods are not mature and have only been applied in samples with simple context, including synthesized templates, plasmid DNA, and mitochondrial DNA.
As discussed above, each method has its own benefits and drawbacks, and led to conflicting conclusions. They differed in specificity, resolution and incidental oxidation, which are three major concerns to evaluate OG sequencing methods. Nonetheless, more data from different methods, especially those with distinct OG recognition mechanisms, are required for the clarification of opposite views.
The crosstalk between OG and G4 at genomic level
As both OGs and G4s might be enriched in the same G-rich regions, it is an intriguing question how they crosstalk with each other. Theoretically, OG could interrupt the G–G Hoogsteen hydrogen bond, while just having a weak impact on the canonical G–C Watson–Crick base pairing (Bielskute et al., 2019; Fleming et al., 2017; Lee et al., 2020). Thus, OG would change the balance between G4 and dsDNA, and is unfavorable for the formation of G4. In contrast, the repair intermedia of OG (i.e., AP sites) could disrupt the Watson–Crick base pairing, and is preferable for G4 (Fleming et al., 2017). Reporter gene assays demonstrated that OGs in PQS-containing promoter sequences could activate downstream transcription (Fleming et al., 2017, 2019; Pastukh et al., 2015; Cogoi et al., 2018). This effect depended on the activity of OGG1 to convert OGs to AP sites, and also required APE1 to be loaded onto the AP sites (Fleming et al., 2017, 2019). Thus, PQSs or G4s are thought to act as a sensor to sense oxidative stress and regulate transcription (Fleming & Burrows, 2020; Linke et al., 2021).
On the other hand, the effects of G4 on OG are complicated. First, since a G4 contains at least four stretches of Gs and the 5’ G of a G stretch is more readily oxidized (Genereux & Barton, 2010; Schuster, 2000; Sugiyama & Saito, 1996), G4s or PQSs were supposed to be hot spots of OGs (Fleming & Burrows, 2020; Linke et al., 2021). In addition to the G track sequence, the structure of G4 would also influence the formation and repair of G oxidation products (Dizdaroglu et al., 2017; Linke et al., 2021). Compared with dsDNA, the formation of G4 would change the types, distribution, and frequencies of G oxidation products along a PQS, as shown by in vitro experiments (Fleming & Burrows, 2013). However, these results were highly dependent on the reaction conditions, e.g., the specific oxidant and its concentration. Second, OGG1, the main glycosylase to repair OGs in human cells, can only recognize OGs in dsDNA but not in G4s or ssDNA (Dizdaroglu et al., 2017). This property conflicts with the role of OG in transcription regulation which need OGG1-generated AP sites to stabilize G4 structure. Moreover, unrepaired OGs in G4s would increase the risk of mutagenesis (Shibutani et al., 1991). To resolve this paradox, the “spare tire” model was proposed based on the fact that ~ 40% of all PQSs had five or more G-tracks (Fleming & Burrows, 2020; Fleming et al., 2018). In this model, when a G in the G4 core is oxidized, the fifth G track can replace the OG-bearing G track and preserve the G4 fold (Fleming et al., 2015, 2017). However, it is not clear whether OGs in the loop regions of G4s can be efficiently repaired by OGG1. Therefore, as a mechanism of oxidation response, the G4–OG model seems to be ineffective and has a high risk of genome instability.
The above results were mainly obtained from synthesized specific PQSs. Recent advantages in G4 and OG sequencing techniques unveiled in vivo connection between them. First, as expected, both G4s and OGs were highly enriched in PQSs (Amente et al., 2019; Ding et al., 2017; Fang & Zou, 2020; Hansel-Hertsch et al., 2016; Marsico et al., 2019; Poetsch et al., 2018; Tu et al., 2021; Zheng et al., 2020). As regions with the highest GC ratio, the TSS-proximal regions were hotspots for both PQSs and G4s (Huppert, 2010; Kwok & Merrick, 2017). However, there seem to be fewer OGs in promoter G-rich regions, as revealed by different studies (Amente et al., 2019; An et al., 2021; Poetsch et al., 2018; Wu et al., 2018). This apparent paradox was resolved by comprehensive analyses of G4P-ChIP-seq (Zheng et al., 2020) and CLAPS-seq (An et al., 2021) data from the same cell line (HeLa cells). The genomic maps of cellular G4s and OGs uncovered reduced OGs in not only TSS-proximal G4s but also TSS-distal G4s, while there were fewer OGs around TSSs with G4P peaks than those without G4P peaks. Moreover, in vitro oxidized genomic DNA showed similar OG distribution, indicating that this pattern was due to the DNA itself, i.e., specific sequences or secondary structures. In sharp contrast to G4s, PQSs without G4P peaks were hotspots of OGs, indicating that specific sequences were not responsible for reduced OG occurrence. Taken together, these results suggested that although the G-rich PQSs are hotspots of OGs, the G4 structure can strongly inhibit the formation of OGs. Therefore, a new model about G4–OG crosstalk was proposed (Fig. 4) (An et al., 2021). The PQSs in dsDNA can be easily oxidized to OGs which are then excised by OGG1. The resulting AP sites can recruit APE1 and facilitate the formation of G4s to regulate downstream transcription. On the other hand, pre-existing G4s are protected from oxidation, avoiding OG-related mutagenesis. Thus, the non-G4 PQSs, but not the pre-existing G4s, may play a role in sensing oxidative stress and regulating gene expression. This model resolves the conflict of the biological roles of OG as a source of genome instability and a gene regulator in the same G-rich regions.
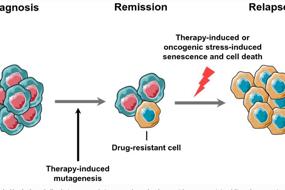
Fig. 4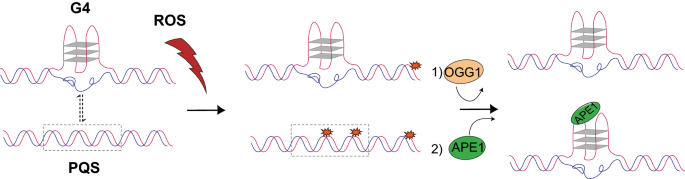
A proposed model of the crosstalk between OG and G4. On one hand, G4s can protect genome integrity by preventing OG formation. On the other hand, non-G4-PQSs are prone to form OGs which can promote the formation of G4 through OGG1 and APE1, and thus regulate downstream transcription in response to oxidative stress. This figure is taken from (An et al., 2021)
Full size imagePerspectives
Mapping G4s and OGs at the genomic level opens the door to investigate how G4s and OGs coordinate at G-rich regions in vivo to regulate transcription and genome integrity. However, there are many limitations in current studies. First, as discussed above, all these sequencing techniques have their own pitfalls, especially artifacts and biases which may compromise the conclusion. Further improvements of sequencing techniques are required to generate more accurate data, and results from different approaches are desired to obtain a comprehensive view for the genomic distributions of G4s and OGs. Second, the repair intermedia of OG, i.e., AP site, as well as the OG oxidation products, namely Gh and Sp, are not included in the analysis. Alternatively, the decrease of OGs in G4s might be attributed to increased oxidation of OG to generate Gh and Sp (Luo et al., 2001; Niles et al., 2001), since G4 can affect the oxidation of G and OG (Fleming & Burrows, 2013). Nonetheless, as Gh and Sp in G4s can be repaired by NEIL1 and NEIL2 (Zhou et al., 2015), oxidation of OGs in G4s should also be beneficial for genome stability. Currently, there are a couple of methods to map AP sites in the genome (Liu et al., 2019; Poetsch et al., 2018), while sequencing Gh or Sp is still unavailable. Integrating information of these OG-derivates is important for elucidating the mechanism of G4–OG crosstalk. Finally, as four human telomeric repeats (TTAGGG) can form a canonical PQS, the existence and functions of G4 and OG in telomere are an attractive question (An et al., 2015; Merta et al., 2019; Poetsch et al., 2018; Rodriguez et al., 2008; Wu et al., 2018). However, it is challenging to perform bioinformatic analysis in the highly repeated telomeric regions. Single-molecular sequencing technology-based methods and/or new bioinformatic tools may help overcome this obstacle in the future.
The genomics of G4 and OG is a fast-growing field. More studies with current approaches and new methods will emerge in the next few years to profile G4s and OGs in the genome, and uncover the mechanism and consequence of G4–OG crosstalk in G-rich regions.
References
Amente, S., Di Palo, G., Scala, G., Castrignano, T., Gorini, F., Cocozza, S., et al. (2019). Genome-wide mapping of 8-oxo-7,8-dihydro-2’-deoxyguanosine reveals accumulation of oxidatively-generated damage at DNA replication origins within transcribed long genes of mammalian cells. Nucleic Acids Research, 47(1), 221–236. https://doi.org/10.1093/nar/gky1152
An, J., Yin, M. D., Yin, J. Y., Wu, S. Z., Selby, C. P., Yang, Y. Y., et al. (2021). Genome-wide analysis of 8-oxo-7,8-dihydro-2’-deoxyguanosine at single-nucleotide resolution unveils reduced occurrence of oxidative damage at G-quadruplex sites. Nucleic Acids Researchearch, 49(21), 12252–12267. https://doi.org/10.1093/nar/gkab1022
An, N., Fleming, A. M., White, H. S., & Burrows, C. J. (2015). Nanopore detection of 8-oxoguanine in the human telomere repeat sequence. ACS Nano, 9(4), 4296–4307. https://doi.org/10.1021/acsnano.5b00722
Badouard, C., Menezo, Y., Panteix, G., Ravanat, J. L., Douki, T., Cadet, J., et al. (2008). Determination of new types of DNA lesions in human sperm. Zygote, 16(1), 9–13. https://doi.org/10.1017/S0967199407004340
Balagurumoorthy, P., & Brahmachari, S. K. (1994). Structure and stability of human telomeric sequence. Journal of Biological Chemistry, 269(34), 21858–21869.
Bedrat, A., Lacroix, L., & Mergny, J. L. (2016). Re-evaluation of G-quadruplex propensity with G4Hunter. Nucleic Acids Research, 44(4), 1746–1759. https://doi.org/10.1093/nar/gkw006
Bielskute, S., Plavec, J., & Podbevsek, P. (2019). Impact of oxidative lesions on the human telomeric G-quadruplex. Journal of the American Chemical Society, 141(6), 2594–2603. https://doi.org/10.1021/jacs.8b12748
Biffi, G., Tannahill, D., McCafferty, J., & Balasubramanian, S. (2013). Quantitative visualization of DNA G-quadruplex structures in human cells. Nature Chemistry, 5(3), 182–186. https://doi.org/10.1038/nchem.1548
Bochman, M. L., Paeschke, K., & Zakian, V. A. (2012). DNA secondary structures: Stability and function of G-quadruplex structures. Nature Reviews Genetics, 13(11), 770–780. https://doi.org/10.1038/nrg3296
Boiteux, S., Coste, F., & Castaing, B. (2017). Repair of 8-oxo-7,8-dihydroguanine in prokaryotic and eukaryotic cells: Properties and biological roles of the Fpg and OGG1 DNA N-glycosylases. Free Radical Biology and Medicine, 107, 179–201. https://doi.org/10.1016/j.freeradbiomed.2016.11.042
Brooks, T. A., Kendrick, S., & Hurley, L. (2010). Making sense of G-quadruplex and i-motif functions in oncogene promoters. FEBS Journal, 277(17), 3459–3469. https://doi.org/10.1111/j.1742-4658.2010.07759.x
Brosh, R. M. (2013). DNA helicases involved in DNA repair and their roles in cancer. Nature Reviews Cancer, 13(8), 542–558. https://doi.org/10.1038/nrc3560
Bryan, T. M. (2019). Mechanisms of DNA replication and repair: Insights from the study of G-quadruplexes. Molecules. https://doi.org/10.3390/molecules24193439
Burge, S., Parkinson, G. N., Hazel, P., Todd, A. K., & Neidle, S. (2006). Quadruplex DNA: Sequence, topology and structure. Nucleic Acids Research, 34(19), 5402–5415. https://doi.org/10.1093/nar/gkl655
Cadet, J., Davies, K. J. A., Medeiros, M. H., Di Mascio, P., & Wagner, J. R. (2017). Formation and repair of oxidatively generated damage in cellular DNA. Free Radical Biology and Medicine, 107, 13–34. https://doi.org/10.1016/j.freeradbiomed.2016.12.049
Cadet, J., Douki, T., Gasparutto, D., & Ravanat, J. L. (2003). Oxidative damage to DNA: Formation, measurement and biochemical features. Mutation Research, 531(1–2), 5–23. https://doi.org/10.1016/j.mrfmmm.2003.09.001
Cadet, J., Douki, T., & Ravanat, J. L. (2010). Oxidatively generated base damage to cellular DNA. Free Radical Biology and Medicine, 49(1), 9–21. https://doi.org/10.1016/j.freeradbiomed.2010.03.025
Cao, B., Wu, X. L., Zhou, J. L., Wu, H., Liu, L. L., Zhang, Q. H., et al. (2020). Nick-seq for single-nucleotide resolution genomic maps of DNA modifications and damage. Nucleic Acids Research, 48(12), 6715–6725. https://doi.org/10.1093/nar/gkaa473
Chambers, V. S., Marsico, G., Boutell, J. M., Di Antonio, M., Smith, G. P., & Balasubramanian, S. (2015). High-throughput sequencing of DNA G-quadruplex structures in the human genome. Nature Biotechnology, 33(8), 877–881. https://doi.org/10.1038/nbt.3295
Cogoi, S., Ferino, A., Miglietta, G., Pedersen, E. B., & Xodo, L. E. (2018). The regulatory G4 motif of the Kirsten ras (KRAS) gene is sensitive to guanine oxidation: Implications on transcription. Nucleic Acids Research, 46(2), 661–676. https://doi.org/10.1093/nar/gkx1142
Cogoi, S., Shchekotikhin, A. E., & Xodo, L. E. (2014). HRAS is silenced by two neighboring G-quadruplexes and activated by MAZ, a zinc-finger transcription factor with DNA unfolding property. Nucleic Acids Research, 42(13), 8379-U8147. https://doi.org/10.1093/nar/gku574
Cogoi, S., & Xodo, L. E. (2006). G-quadruplex formation within the promoter of the KRAS proto-oncogene and its effect on transcription. Nucleic Acids Research, 34(9), 2536–2549. https://doi.org/10.1093/nar/gkl286
Costello, M., Pugh, T. J., Fennell, T. J., Stewart, C., Lichtenstein, L., Meldrim, J. C., et al. (2013). Discovery and characterization of artifactual mutations in deep coverage targeted capture sequencing data due to oxidative DNA damage during sample preparation. Nucleic Acids Research, 41(6), e67. https://doi.org/10.1093/nar/gks1443
David, S. S., & Wiliams, S. D. (1998). Chemistry of glycosylases and endonucleases involved in base-excision repair. Chemical Reviews, 98(3), 1221–1261. https://doi.org/10.1021/cr980321h
Delaney, S., Jarem, D. A., Volle, C. B., & Yennie, C. J. (2012). Chemical and biological consequences of oxidatively damaged guanine in DNA. Free Radic Research, 46(4), 420–441. https://doi.org/10.3109/10715762.2011.653968
Ding, J., Taylor, M. S., Jackson, A. P., & Reijns, M. A. M. (2015). Genome-wide mapping of embedded ribonucleotides and other noncanonical nucleotides using emRiboSeq and EndoSeq. Nature Protocols, 10(9), 1433–1444. https://doi.org/10.1038/nprot.2015.099
Ding, Y., Fleming, A. M., & Burrows, C. J. (2017). Sequencing the Mouse Genome for the Oxidatively Modified Base 8-Oxo-7,8-dihydroguanine by OG-Seq. Journal of the American Chemical Society, 139(7), 2569–2572. https://doi.org/10.1021/jacs.6b12604
Dizdaroglu, M., Coskun, E., & Jaruga, P. (2017). Repair of oxidatively induced DNA damage by DNA glycosylases: Mechanisms of action, substrate specificities and excision kinetics. Mutation Research-Reviews in Mutation Research, 771, 99–127. https://doi.org/10.1016/j.mrrev.2017.02.001
European Standards Committee on Oxidative, D. N. A. D. (2003). Measurement of DNA oxidation in human cells by chromatographic and enzymic methods. Free Radical Biology and Medicine, 34(8), 1089–1099. https://doi.org/10.1016/s0891-5849(03)00041-8
Fang, G., & Cech, T. R. (1993). The beta subunit of Oxytricha telomere-binding protein promotes G-quartet formation by telomeric DNA. Cell, 74(5), 875–885. https://doi.org/10.1016/0092-8674(93)90467-5
Fang, Y., & Zou, P. (2020). Genome-wide mapping of oxidative DNA damage via engineering of 8-Oxoguanine DNA Glycosylase. Biochemistry, 59(1), 85–89. https://doi.org/10.1021/acs.biochem.9b00782
Fleming, A. M., & Burrows, C. J. (2013). G-quadruplex folds of the human telomere sequence alter the site reactivity and reaction pathway of guanine oxidation compared to duplex DNA. Chemical Research in Toxicology, 26(4), 593–607. https://doi.org/10.1021/tx400028y
Fleming, A. M., & Burrows, C. J. (2020). Interplay of guanine oxidation and G-quadruplex folding in gene promoters. Journal of the American Chemical Society, 142(3), 1115–1136. https://doi.org/10.1021/jacs.9b11050
Fleming, A. M., Ding, Y., & Burrows, C. J. (2017). Oxidative DNA damage is epigenetic by regulating gene transcription via base excision repair. Proceedings of the National Academy of Sciences of the United States of America, 114(10), 2604–2609. https://doi.org/10.1073/pnas.1619809114
Fleming, A. M., Zhou, J., Wallace, S. S., & Burrows, C. J. (2015). A role for the fifth G-track in G-quadruplex forming oncogene promoter sequences during oxidative stress: Do these “Spare Tires” have an evolved function? Acs Central Science, 1(5), 226–233. https://doi.org/10.1021/acscentsci.5b00202
Fleming, A. M., Zhu, J., Ding, Y., Visser, J. A., Zhu, J. L., & Burrows, C. J. (2018). Human DNA repair genes possess potential G-quadruplex sequences in their promoters and 5 ’-untranslated regions. Biochemistry, 57(6), 991–1002. https://doi.org/10.1021/acs.biochem.7b01172
Fleming, A. M., Zhu, J., Howpay Manage, S. A., & Burrows, C. J. (2019). Human NEIL3 gene expression regulated by epigenetic-like oxidative DNA modification. Journal of the American Chemical Society, 141(28), 11036–11049. https://doi.org/10.1021/jacs.9b01847
Gedik, C. M., Collins, A., Dubois, J., Duez, P., Kouegnigan, L., Rees, J. F., et al. (2005). Establishing the background level of base oxidation in human lymphocyte DNA: Results of an interlaboratory validation study. Faseb Journal, 19(1), 82–84. https://doi.org/10.1096/fj.04-1767fje
Genereux, J. C., & Barton, J. K. (2010). Mechanisms for DNA charge transport. Chemical Reviews, 110(3), 1642–1662. https://doi.org/10.1021/cr900228f
Gilat, N., Fridman, D., Sharim, H., Margalit, S., Gassman, N. R., Michaeli, Y., et al. (2021). From single-molecule to genome-wide mapping of DNA lesions: Repair-assisted damage detection sequencing. Biophysics Reports (n y). https://doi.org/10.1016/j.bpr.2021.100017
Gorini, F., Scala, G., Cooke, M. S., Majello, B., & Amente, S. (2021). Towards a comprehensive view of 8-oxo-7,8-dihydro-2’-deoxyguanosine: Highlighting the intertwined roles of DNA damage and epigenetics in genomic instability. DNA Repair (amst), 97, 103027. https://doi.org/10.1016/j.dnarep.2020.103027
Gorini, F., Scala, G., Di Palo, G., Dellino, G. I., Cocozza, S., Pelicci, P. G., et al. (2020). The genomic landscape of 8-oxodG reveals enrichment at specific inherently fragile promoters. Nucleic Acids Research, 48(8), 4309–4324. https://doi.org/10.1093/nar/gkaa175
Gray, R. D., & Chaires, J. B. (2008). Kinetics and mechanism of K(+)- and Na(+)-induced folding of models of human telomeric DNA into G-quadruplex structures. Nucleic Acids Research, 36(12), 4191–4203. https://doi.org/10.1093/nar/gkn379
Guedin, A., Gros, J., Alberti, P., & Mergny, J. L. (2010). How long is too long? Effects of loop size on G-quadruplex stability. Nucleic Acids Research, 38(21), 7858–7868. https://doi.org/10.1093/nar/gkq639
Hansel-Hertsch, R., Beraldi, D., Lensing, S. V., Marsico, G., Zyner, K., Parry, A., et al. (2016). G-quadruplex structures mark human regulatory chromatin. Nature Genetics, 48(10), 1267–1272. https://doi.org/10.1038/ng.3662
Hansel-Hertsch, R., Di Antonio, M., & Balasubramanian, S. (2017). DNA G-quadruplexes in the human genome: Detection, functions and therapeutic potential. Nature Reviews Molecular Cell Biology, 18(5), 279–284. https://doi.org/10.1038/nrm.2017.3
Hansel-Hertsch, R., Spiegel, J., Marsico, G., Tannahill, D., & Balasubramanian, S. (2018). Genome-wide mapping of endogenous G-quadruplex DNA structures by chromatin immunoprecipitation and high-throughput sequencing. Nature Protocols, 13(3), 551–564. https://doi.org/10.1038/nprot.2017.150
Hon, J., Martinek, T., Zendulka, J., & Lexa, M. (2017). pqsfinder: an exhaustive and imperfection-tolerant search tool for potential quadruplex-forming sequences in R. Bioinformatics, 33(21), 3373–3379. https://doi.org/10.1093/bioinformatics/btx413
Huber, M. D., Lee, D. C., & Maizels, N. (2002). G4 DNA unwinding by BLM and Sgs1p: Substrate specificity and substrate-specific inhibition. Nucleic Acids Research, 30(18), 3954–3961. https://doi.org/10.1093/nar/gkf530
Hud, N. V., Smith, F. W., Anet, F. A. L., & Feigon, J. (1996). The selectivity for K+ versus Na+ in DNA quadruplexes is dominated by relative free energies of hydration: A thermodynamic analysis by H-1 NMR. Biochemistry, 35(48), 15383–15390. https://doi.org/10.1021/bi9620565
Hui, W. W. I., Simeone, A., Zyner, K. G., Tannahill, D., & Balasubramanian, S. (2022). Single-cell mapping of DNA G-quadruplex structures in human cancer cells. Scientific Reports. https://doi.org/10.1038/s41598-022-05047-8
Huppert, J. L. (2010). Structure, location and interactions of G-quadruplexes. FEBS Journal, 277(17), 3452–3458. https://doi.org/10.1111/j.1742-4658.2010.07758.x
Huppert, J. L., & Balasubramanian, S. (2005). Prevalence of quadruplexes in the human genome. Nucleic Acids Research, 33(9), 2908–2916. https://doi.org/10.1093/nar/gki609
Jin, S. G., Meng, Y., Johnson, J., Szabo, P. E., & Pfeifer, G. P. (2022). Concordance of hydrogen peroxide-induced 8-oxo-guanine patterns with two cancer mutation signatures of upper GI tract tumors. Science Advances, 8(22), eabn3815. https://doi.org/10.1126/sciadv.abn3815
Kasai, H. (1997). Analysis of a form of oxidative DNA damage, 8-hydroxy-2’-deoxyguanosine, as a marker of cellular oxidative stress during carcinogenesis. Mutation Research-Reviews in Mutation Research, 387(3), 147–163. https://doi.org/10.1016/S1383-5742(97)00035-5
Krishnamurthy, N., Haraguchi, K., Greenberg, M. M., & David, S. S. (2008). Efficient removal of formamidopyrimidines by 8-oxoguanine glycosylases. Biochemistry, 47(3), 1043–1050. https://doi.org/10.1021/bi701619u
Kwok, C. K., & Merrick, C. J. (2017). G-Quadruplexes: Prediction, characterization, and biological application. Trends in Biotechnology, 35(10), 997–1013. https://doi.org/10.1016/j.tibtech.2017.06.012
Lam, E. Y., Beraldi, D., Tannahill, D., & Balasubramanian, S. (2013). G-quadruplex structures are stable and detectable in human genomic DNA. Nature Communications, 4, 1796. https://doi.org/10.1038/ncomms2792
Lee, H. T., Sanford, S., Paul, T., Choe, J., Bose, A., Opresko, P. L., et al. (2020). Position-dependent effect of guanine base damage and mutations on telomeric G-quadruplex and telomerase extension. Biochemistry, 59(28), 2627–2639. https://doi.org/10.1021/acs.biochem.0c00434
Lerner, L. K., & Sale, J. E. (2019). Replication of G quadruplex DNA. Genes. https://doi.org/10.3390/genes10020095
Li, C., Wang, H., Yin, Z., Fang, P., Xiao, R., Xiang, Y., et al. (2021). Ligand-induced native G-quadruplex stabilization impairs transcription initiation. Genome Research, 31(9), 1546–1560. https://doi.org/10.1101/gr.275431.121
Linke, R., Limmer, M., Juranek, S. A., Heine, A., & Paeschke, K. (2021). The relevance of G-quadruplexes for DNA repair. International Journal of Molecular Sciences. https://doi.org/10.3390/ijms222212599
Liu, H. Y., Zhao, Q., Zhang, T. P., Wu, Y., Xiong, Y. X., Wang, S. K., et al. (2016). Conformation selective antibody enables genome profiling and leads to discovery of parallel G-quadruplex in human telomeres. Cell Chemical Biology, 23(10), 1261–1270. https://doi.org/10.1016/j.chembiol.2016.08.013
Liu, Z. J., Cuesta, S. M., van Delft, P., & Balasubramanian, S. (2019). Sequencing abasic sites in DNA at single-nucleotide resolution. Nature Chemistry, 11(7), 629–637. https://doi.org/10.1038/s41557-019-0279-9
Lodato, M. A., Rodin, R. E., Bohrson, C. L., Coulter, M. E., Barton, A. R., Kwon, M., et al. (2018). Aging and neurodegeneration are associated with increased mutations in single human neurons. Science, 359(6375), 555–559. https://doi.org/10.1126/science.aao4426
Luo, W., Muller, J. G., Rachlin, E. M., & Burrows, C. J. (2001). Characterization of hydantoin products from one-electron oxidation of 8-oxo-7,8-dihydroguanosine in a nucleoside model. Chemical Research in Toxicology, 14(7), 927–938. https://doi.org/10.1021/tx010072j
Lyu, J., Shao, R., Kwong Yung, P. Y., & Elsasser, S. J. (2022). Genome-wide mapping of G-quadruplex structures with CUT&Tag. Nucleic Acids Research, 50(3), e13. https://doi.org/10.1093/nar/gkab1073
Maizels, N. (2006). Dynamic roles for G4 DNA in the biology of eukaryotic cells. Nature Structural & Molecular Biology, 13(12), 1055–1059. https://doi.org/10.1038/nsmb1171
Mangal, D., Vudathala, D., Park, J. H., Lee, S. H., Penning, T. M., & Blair, I. A. (2009). Analysis of 7,8-dihydro-8-oxo-2’-deoxyguanosine in cellular DNA during oxidative stress. Chemical Research in Toxicology, 22(5), 788–797. https://doi.org/10.1021/tx800343c
Marsico, G., Chambers, V. S., Sahakyan, A. B., McCauley, P., Boutell, J. M., Antonio, M. D., et al. (2019). Whole genome experimental maps of DNA G-quadruplexes in multiple species. Nucleic Acids Research, 47(8), 3862–3874. https://doi.org/10.1093/nar/gkz179
Merta, T. J., Geacintov, N. E., & Shafirovich, V. (2019). Generation of 8-oxo-7,8-dihydroguanine in G-quadruplexes models of human telomere sequences by one-electron oxidation. Photochemistry and Photobiology, 95(1), 244–251. https://doi.org/10.1111/php.12926
Mitchell, D. L., Meador, J., Paniker, L., Gasparutto, D., Jeffrey, W. H., & Cadet, J. (2002). Development and application of a novel immunoassay for measuring oxidative DNA damage in the environment. Photochemistry and Photobiology, 75(3), 257–265. https://doi.org/10.1562/0031-8655(2002)075%3c0257:daaoan%3e2.0.co;2
Mohaghegh, P., Karow, J. K., Brosh, R. M., Jr., Bohr, V. A., & Hickson, I. D. (2001). The Bloom’s and Werner’s syndrome proteins are DNA structure-specific helicases. Nucleic Acids Research, 29(13), 2843–2849. https://doi.org/10.1093/nar/29.13.2843
Mukundan, V. T., & Phan, A. T. (2013). Bulges in G-quadruplexes: broadening the definition of G-quadruplex-forming sequences. Journal of the American Chemical Society, 135(13), 5017–5028. https://doi.org/10.1021/ja310251r
Neeley, W. L., & Essigmann, J. M. (2006). Mechanisms of formation, genotoxicity, and mutation of guanine oxidation products. Chemical Research in Toxicology, 19(4), 491–505. https://doi.org/10.1021/tx0600043
Niles, J. C., Wishnok, J. S., & Tannenbaum, S. R. (2001). Spiroiminodihydantoin is the major product of the 8-oxo-7,8-dihydroguanosine reaction with peroxynitrite in the presence of thiols and guanosine photooxidation by methylene blue. Organic Letters, 3(7), 963–966. https://doi.org/10.1021/ol006993n
Ohno, M., Miura, T., Furuichi, M., Tominaga, Y., Tsuchimoto, D., Sakumi, K., et al. (2006). A genome-wide distribution of 8-oxoguanine correlates with the preferred regions for recombination and single nucleotide polymorphism in the human genome. Genome Research, 16(5), 567–575. https://doi.org/10.1101/gr.4769606
Pan, L., Zhu, B., Hao, W., Zeng, X., Vlahopoulos, S. A., Hazra, T. K., et al. (2016). Oxidized guanine base lesions function in 8-oxoguanine DNA glycosylase-1-mediated epigenetic regulation of nuclear factor κb-driven gene expression. Journal of Biological Chemistry, 291(49), 25553–25566. https://doi.org/10.1074/jbc.M116.751453
Pastukh, V., Roberts, J. T., Clark, D. W., Bardwell, G. C., Patel, M., Al-Mehdi, A. B., et al. (2015). An oxidative DNA “damage” and repair mechanism localized in the VEGF promoter is important for hypoxia-induced VEGF mRNA expression. American Journal of Physiology-Lung Cellular and Molecular Physiology, 309(11), L1367–L1375. https://doi.org/10.1152/ajplung.00236.2015
Patel, D. J., Phan, A. T., & Kuryavyi, V. (2007). Human telomere, oncogenic promoter and 5’-UTR G-quadruplexes: Diverse higher order DNA and RNA targets for cancer therapeutics. Nucleic Acids Research, 35(22), 7429–7455. https://doi.org/10.1093/nar/gkm711
Perillo, B., Ombra, M. N., Bertoni, A., Cuozzo, C., Sacchetti, S., Sasso, A., et al. (2008). DNA oxidation as triggered by H3K9me2 demethylation drives estrogen-induced gene expression. Science, 319(5860), 202–206. https://doi.org/10.1126/science.1147674
Piekna-Przybylska, D., Sullivan, M. A., Sharma, G., & Bambara, R. A. (2014). U3 region in the HIV-1 genome adopts a G-quadruplex structure in its RNA and DNA sequence. Biochemistry, 53(16), 2581–2593. https://doi.org/10.1021/bi4016692
Poetsch, A. R., Boulton, S. J., & Luscombe, N. M. (2018). Genomic landscape of oxidative DNA damage and repair reveals regioselective protection from mutagenesis. Genome Biology, 19(1), 215. https://doi.org/10.1186/s13059-018-1582-2
Pratviel, G., & Meunier, B. (2006). Guanine oxidation: One- and two-electron reactions. Chemistry, 12(23), 6018–6030. https://doi.org/10.1002/chem.200600539
Ravanat, J. L., Douki, T., Duez, P., Gremaud, E., Herbert, K., Hofer, T., et al. (2002). Cellular background level of 8-oxo-7,8-dihydro-2’-deoxyguanosine: An isotope based method to evaluate artefactual oxidation of DNA during its extraction and subsequent work-up. Carcinogenesis, 23(11), 1911–1918. https://doi.org/10.1093/carcin/23.11.1911
Ray, S., Bandaria, J. N., Qureshi, M. H., Yildiz, A., & Balci, H. (2014). G-quadruplex formation in telomeres enhances POT1/TPP1 protection against RPA binding. Proceedings of the National Academy of Sciences of the United States of America, 111(8), 2990–2995. https://doi.org/10.1073/pnas.1321436111
Rhodes, D., & Lipps, H. J. (2015). G-quadruplexes and their regulatory roles in biology. Nucleic Acids Research, 43(18), 8627–8637. https://doi.org/10.1093/nar/gkv862
Rodriguez, R., Muller, S., Yeoman, J. A., Trentesaux, C., Riou, J. F., & Balasubramanian, S. (2008). A novel small molecule that alters shelterin integrity and triggers a DNA-damage response at telomeres. Journal of the American Chemical Society, 130(47), 15758–15759. https://doi.org/10.1021/ja805615w
Roychoudhury, S., Pramanik, S., Harris, H. L., Tarpley, M., Sarkar, A., Spagnol, G., et al. (2020). Endogenous oxidized DNA bases and APE1 regulate the formation of G-quadruplex structures in the genome. Proceedings of the National Academy of Sciences of the United States of America, 117(21), 11409–11420. https://doi.org/10.1073/pnas.1912355117
Sahakyan, A. B., Chambers, V. S., Marsico, G., Santner, T., Di Antonio, M., & Balasubramanian, S. (2017). Machine learning model for sequence-driven DNA G-quadruplex formation. Scientific Reports, 7(1), 14535. https://doi.org/10.1038/s41598-017-14017-4
Sakamoto, K., Tominaga, Y., Yamauchi, K., Nakatsu, Y., Sakumi, K., Yoshiyama, K., et al. (2007). MUTYH-null mice are susceptible to spontaneous and oxidative stress induced intestinal tumorigenesis. Cancer Research, 67(14), 6599–6604. https://doi.org/10.1158/0008-5472.CAN-06-4802
Sanders, C. M. (2010). Human Pif1 helicase is a G-quadruplex DNA-binding protein with G-quadruplex DNA-unwinding activity. Biochemical Journal, 430, 119–128. https://doi.org/10.1042/Bj20100612
Santos, T., Salgado, G. F., Cabrita, E. J., & Cruz, C. (2022). Nucleolin: A binding partner of G-quadruplex structures. Trends in Cell Biology, 32(7), 561–564. https://doi.org/10.1016/j.tcb.2022.03.003
Sarkies, P., Murat, P., Phillips, L. G., Patel, K. J., Balasubramanian, S., & Sale, J. E. (2012). FANCJ coordinates two pathways that maintain epigenetic stability at G-quadruplex DNA. Nucleic Acids Research, 40(4), 1485–1498. https://doi.org/10.1093/nar/gkr868
Sauer, M., & Paeschke, K. (2017). G-quadruplex unwinding helicases and their function in vivo. Biochemical Society Transactions, 45, 1173–1182. https://doi.org/10.1042/Bst20170097
Scala, G., Gorini, F., Ambrosio, S., Chiariello, A. M., Nicodemi, M., Lania, L., et al. (2022). 8-oxodG accumulation within super-enhancers marks fragile CTCF-mediated chromatin loops. Nucleic Acids Research, 50(6), 3292–3306. https://doi.org/10.1093/nar/gkac143
Schadt, E. E., Banerjee, O., Fang, G., Feng, Z. X., Wong, W. H., Zhang, X. G., et al. (2013). Modeling kinetic rate variation in third generation DNA sequencing data to detect putative modifications to DNA bases. Genome Research, 23(1), 129–141. https://doi.org/10.1101/gr.136739.111
Schneider, V. A., Graves-Lindsay, T., Howe, K., Bouk, N., Chen, H. C., Kitts, P. A., et al. (2017). Evaluation of GRCh38 and de novo haploid genome assemblies demonstrates the enduring quality of the reference assembly. Genome Research, 27(5), 849–864. https://doi.org/10.1101/gr.213611.116
Schuster, G. B. (2000). Long-range charge transfer in DNA: Transient structural distortions control the distance dependence. Accounts of Chemical Research, 33(4), 253–260. https://doi.org/10.1021/ar980059z
Sen, D., & Gilbert, W. (1988). Formation of parallel four-stranded complexes by guanine-rich motifs in DNA and its implications for meiosis. Nature, 334(6180), 364–366. https://doi.org/10.1038/334364a0
Sen, D., & Gilbert, W. (1990). A sodium-potassium switch in the formation of four-stranded G4-DNA. Nature, 344(6265), 410–414. https://doi.org/10.1038/344410a0
Serrano, J., Palmeira, C. M., Wallace, K. B., & Kuehl, D. W. (1996). Determination of 8-hydroxydeoxyguanosine in biological tissue by liquid chromatography/electrospray ionization-mass spectrometry/mass spectrometry. Rapid Communications in Mass Spectrometry, 10(14), 1789–1791. https://doi.org/10.1002/(SICI)1097-0231(199611)10:14%3c1789::AID-RCM752%3e3.0.CO;2-6
Shibutani, S., Takeshita, M., & Grollman, A. P. (1991). Insertion of specific bases during DNA synthesis past the oxidation-damaged base 8-oxodG. Nature, 349(6308), 431–434. https://doi.org/10.1038/349431a0
Siddiqui-Jain, A., Grand, C. L., Bearss, D. J., & Hurley, L. H. (2002). Direct evidence for a G-quadruplex in a promoter region and its targeting with a small molecule to repress c-MYC transcription. Proceedings of the National Academy of Sciences of the United States of America, 99(18), 11593–11598. https://doi.org/10.1073/pnas.182256799
Spiegel, J., Adhikari, S., & Balasubramanian, S. (2020). The structure and function of DNA G-quadruplexes. Trends in Chemistry, 2(2), 123–136. https://doi.org/10.1016/j.trechm.2019.07.002
Steenken, S., & Jovanovic, S. V. (1997). How easily oxidizable is DNA? One-electron reduction potentials of adenosine and guanosine radicals in aqueous solution. Journal of the American Chemical Society, 119(3), 617–618. https://doi.org/10.1021/ja962255b
Steenken, S., Jovanovic, S. V., Bietti, M., & Bernhard, K. (2000). The trap depth (in DNA) of 8-oxo-7,8-dihydro-2 ’ deoxyguanosine as derived from electron-transfer equilibria in aqueous solution. Journal of the American Chemical Society, 122(10), 2373–2374. https://doi.org/10.1021/ja993508e
Sugiyama, H., & Saito, I. (1996). Theoretical studies of GC-specific photocleavage of DNA via electron transfer: Significant lowering of ionization potential and 5’-localization of HOMO of stacked GG bases in B-form DNA. Journal of the American Chemical Society, 118(30), 7063–7068. https://doi.org/10.1021/ja9609821
Todd, A. K., Johnston, M., & Neidle, S. (2005). Highly prevalent putative quadruplex sequence motifs in human DNA. Nucleic Acids Research, 33(9), 2901–2907. https://doi.org/10.1093/nar/gki553
Tu, J., Duan, M. Q., Liu, W. L., Lu, N., Zhou, Y., Sun, X., et al. (2021). Direct genome-wide identification of G-quadruplex structures by whole-genome resequencing. Nature Communications. https://doi.org/10.1038/s41467-021-26312-w
Valton, A. L., Hassan-Zadeh, V., Lema, I., Boggetto, N., Alberti, P., Saintome, C., et al. (2014). G4 motifs affect origin positioning and efficiency in two vertebrate replicators. EMBO Journal, 33(7), 732–746. https://doi.org/10.1002/embj.201387506
Varshney, D., Spiegel, J., Zyner, K., Tannahill, D., & Balasubramanian, S. (2020). The regulation and functions of DNA and RNA G-quadruplexes. Nature Reviews Molecular Cell Biology, 21(8), 459–474. https://doi.org/10.1038/s41580-020-0236-x
Watson, J. D., & Crick, F. H. (1953). Molecular structure of nucleic acids; a structure for deoxyribose nucleic acid. Nature, 171(4356), 737–738. https://doi.org/10.1038/171737a0
Weitzmann, M. N., Woodford, K. J., & Usdin, K. (1996). The development and use of a DNA polymerase arrest assay for the evaluation of parameters affecting intrastrand tetraplex formation. Journal of Biological Chemistry, 271(34), 20958–20964. https://doi.org/10.1074/jbc.271.34.20958
Wu, J., McKeague, M., & Sturla, S. J. (2018). Nucleotide-resolution genome-wide mapping of oxidative DNA damage by click-code-seq. Journal of the American Chemical Society, 140(31), 9783–9787. https://doi.org/10.1021/jacs.8b03715
Xiao, S., Zhang, J. Y., Wu, J., Wu, R. Y., Xia, Y., Zheng, K. W., et al. (2014). Formation of DNA:RNA hybrid G-quadruplexes of two G-quartet layers in transcription: Expansion of the prevalence and diversity of G-quadruplexes in genomes. Angewandte Chemie International Edition in English, 53(48), 13110–13114. https://doi.org/10.1002/anie.201407045
Xie, Y., Yang, H., Cunanan, C., Okamoto, K., Shibata, D., Pan, J., et al. (2004). Deficiencies in mouse Myh and Ogg1 result in tumor predisposition and G to T mutations in codon 12 of the K-ras oncogene in lung tumors. Cancer Research, 64(9), 3096–3102. https://doi.org/10.1158/0008-5472.can-03-3834
Xu, Y. (2011). Chemistry in human telomere biology: Structure, function and targeting of telomere DNA/RNA. Chemical Society Reviews, 40(5), 2719–2740. https://doi.org/10.1039/c0cs00134a
Xue, L., & Greenberg, M. M. (2007). Facile quantification of lesions derived from 2’-deoxyguanosine in DNA. Journal of the American Chemical Society, 129(22), 7010–7011. https://doi.org/10.1021/ja072174n
Yoshihara, M., Jiang, L., Akatsuka, S., Suyama, M., & Toyokuni, S. (2014). Genome-wide profiling of 8-oxoguanine reveals its association with spatial positioning in nucleus. DNA Research, 21(6), 603–612. https://doi.org/10.1093/dnares/dsu023
Yu, Y., Cui, Y., Niedernhofer, L. J., & Wang, Y. (2016). Occurrence, biological consequences, and human health relevance of oxidative stress-induced DNA damage. Chemical Research in Toxicology, 29(12), 2008–2039. https://doi.org/10.1021/acs.chemrestox.6b00265
Zatopek, K. M., Potapov, V., Maduzia, L. L., Alpaslan, E., Chen, L., Evans, T. C., Jr., et al. (2019). RADAR-seq: A RAre DAmage and Repair sequencing method for detecting DNA damage on a genome-wide scale. DNA Repair (amst), 80, 36–44. https://doi.org/10.1016/j.dnarep.2019.06.007
Zhang, L. G., Kasif, S., Cantor, C. R., & Broude, N. E. (2004). GC/AT-content spikes as genomic punctuation marks. Proceedings of the National Academy of Sciences of the United States of America, 101(48), 16855–16860. https://doi.org/10.1073/pnas.0407821101
Zheng, K. W., Zhang, J. Y., He, Y. D., Gong, J. Y., Wen, C. J., Chen, J. N., et al. (2020). Detection of genomic G-quadruplexes in living cells using a small artificial protein. Nucleic Acids Research, 48(20), 11706–11720. https://doi.org/10.1093/nar/gkaa841
Zhou, J., Fleming, A. M., Averill, A. M., Burrows, C. J., & Wallace, S. S. (2015). The NEIL glycosylases remove oxidized guanine lesions from telomeric and promoter quadruplex DNA structures (vol 43, pg 4039, 2015). Nucleic Acids Research, 43(14), 7171–7171. https://doi.org/10.1093/nar/gkv673
Funding
This study is supported by the National Natural Science Foundation of China (NSFC) [31870804, 21807013], Program for Professor of Special Appointment (Eastern Scholar) at Shanghai Institutions of Higher Learning [2019], Shanghai Outstanding Young Talent Program [2019], innovative research team of high-level local university in Shanghai, Shanghai Municipal Natural Science Foundation [22ZR1413900] to J.H.
Author information
Jiao An and Mengdie Yin wish it to be known that, in their opinion, the authors should be regarded as joint first authors.
Authors and Affiliations
Shanghai Fifth People’s Hospital, Fudan University, Shanghai Key Laboratory of Medical Epigenetics, International Co-laboratory of Medical Epigenetics and Metabolism (Ministry of Science and Technology), Institutes of Biomedical Sciences, Fudan University, Shanghai, 200032, China
Jiao An, Mengdie Yin & Jinchuan Hu
Corresponding author
Correspondence to Jinchuan Hu.
Ethics declarations
Conflict of interest
The authors declare no conflict of interest.
Rights and permissions
Springer Nature or its licensor holds exclusive rights to this article under a publishing agreement with the author(s) or other rightsholder(s); author self-archiving of the accepted manuscript version of this article is solely governed by the terms of such publishing agreement and applicable law.
About this article
Cite this article
An, J., Yin, M. & Hu, J. G-quadruplex and 8-oxo-7,8-dihydroguanine across the genome: methodologies and crosstalk. GENOME INSTAB. DIS. 3, 241–254 (2022). https://doi.org/10.1007/s42764-022-00082-1
Received26 July 2022
Revised05 September 2022
Accepted06 September 2022
Published17 September 2022
Issue DateOctober 2022
DOIhttps://doi.org/10.1007/s42764-022-00082-1
Share this article
Anyone you share the following link with will be able to read this content:
Get shareable linkKeywords
G-quadruplex (G4)
8-Oxo-7,8-dihydroguanine (OG)
Genome-wide mapping
用户登录
还没有账号?
立即注册