Accurate prediction of stomach adenocarcinomas of poorest and best prognosis with a combination of gene expression and clinical signatures
Original Research Paper
Lingyu Qiu, Huayu Kang, Jielin Yang, Yidong Zheng, Aiyue Chen, Chunlin Chen, Xinlong Wang, Qiongfang Fang, Wei-Guo Zhu, Ou Sha & Yejun Wang
Genome Instability & Disease 3, 227–237 (2022)
Abstract
The genetic heterogeneity hampers the identification of biomarkers for Stomach adenocarcinoma (STAD). Here, we proposed a new pipeline to screen the cross-cohort reliable prognostic RNA signatures, and to develop practically applicable models predicting the gastric cancers with shortest and longest overall survival. A strategy of bi-end stratification combined with supervised comparison and LASSO regression was proposed, which could largely improve the statistical power in identification of prognostic gene signatures. By the strategy, we identified 12 signature genes whose expression was associated with the poorest prognosis, and other 12 genes associated with the best prognosis of STAD. Stably expressed genes (SEGs) among different cell types of normal and diseased stomachs were identified using single-cell RNA-seq data, expression levels of the signature genes were normalized with these SEGs, and multi-gene Cox models were built with the normalized expression of the signature genes with the training cohort. The models could well predict the STAD cases of poorest and best prognosis. Combination of stage information further improved the prediction performance, with the accuracy reaching 0.69–0.84 for poorest prognosis and 0.75–0.81 for best prognosis prediction in independent STAD cohorts. The study identified cross-cohort stable STAD prognosis-associated genes, and developed two practically applicable multi-gene models identifying STAD cases of poorest and best prognosis effectively.
Introduction
Globally, the incidence of gastric cancer ranks the fifth among malignant tumors, and the mortality rate ranks the third. The incidence of gastric cancer in men is two to three times higher than in women. Over 50% of the new cases occur in developing countries, while East Asia is the region of highest incidence worldwide (Bray et al., 2018). According to the World Health Organization (WHO) estimates in 2015, approximately 990,000 people around the world are diagnosed with gastric cancer each year, including approximately 738,000 deaths (Ferlay et al., 2010). Due to the lack of early screening procedures, and most patients being asymptomatic or with slight symptoms, patients with gastric cancer are often already in the advanced stage at the time of diagnosis (Siegel et al., 2020). Patients of early gastric cancer can achieve a five-year survival rate of about 70% through radical surgery (American Cancer Society, 2022). For advanced gastric cancer, surgery and 5-fluorouracil-based adjuvant chemotherapy (ACT) is the major treatment regimen (Cho et al., 2017; Sakuramoto et al., 2007). Although therapies including chemotherapy have progressed largely, the survival rate of the gastric cancer patients at advanced stages has dropped significantly and has a higher rate of recurrence compared with that of patients at early stages. Except in Japan, the overall worldwide five-year survival rate for advanced-stage gastric cancer is lower than 30% (Isobe et al., 2011; Siegel et al., 2014).
Gastric cancer is a multifactorial disease. Patients of different races and stages often have distinct clinical outcomes (Kamangar et al., 2006; Siegel et al., 2020). Factors such as diet, Helicobacter pylori infection, smoking, genetic factors and single nucleotide polymorphisms (SNPs) all play roles in the development of gastric cancer (“IARC monographs on the evaluation of carcinogenic risks to humans. Ingested nitrate and nitrite, and cyanobacterial peptide toxins, 2010”; Kamangar et al., 2011; Karimi et al., 2014; Shi et al., 2011; Study Group of Millennium Genome Project for et al., 2008; Tsugane et al., 2004). Even though the correlation has been confirmed between many of the above factors and the prognosis of gastric cancer, there remains large heterogeneity. For instance, patients of gastric cancer at the same stage and receiving similar treatments still have extensive survival heterogeneity (Fang et al., 2020; Noh et al., 2014; Sasako et al., 2010). It also aggravates the difficulty in choosing the appropriate treatment for the patients (Van Cutsem et al., 2016). It is particularly urgent and important to develop a more effective prognostic evaluation system for gastric cancer (McLean & El-Omar, 2014; Sasako et al., 2010).
In recent years, with the advances of high-throughput sequencing technology and its application in gastric cancer, many studies have been performed, revealing the high heterogeneity of gastric cancer at the genetics (Cancer Genome Atlas Research, 2014; Cristescu et al., 2015), gene expression (Boussioutas et al., 2003; Lei et al., 2013; Tan et al., 2011) and other molecular levels (Abnet et al., 2010; Ni et al., 2019; Ooi et al., 2016; Zhang et al., 2019). Recently, genome-based molecular signatures were comprehensively identified and employed by The Cancer Genome Atlas (TCGA) to classify stomach adenocarcinomas (STADs) into four subtypes, namely, Epstein–Barr virus positive (EBV), microsatellite instable (MSI), genome stable (GS), and chromosomal instability (CIN) (Cancer Genome Atlas Research, 2014). A gene expression-based study from the Asian Cancer Research Group (ACRG) also classified STADs into two major subtypes, MSI and microsatellite stable (MSS), while MSS STADs were further subdivided into three subtypes, epithelial-to-mesenchymal transition (EMT), TP53 active (TP53 +), and TP53 inactive (TP53-) (Cristescu et al., 2015). In addition, many studies have found significant differences in gene expression in gastric cancer patients with different prognosis (Abnet et al., 2010; Fang et al., 2020; Jiang et al., 2018; Kim et al., 2020; Wang et al., 2010).These biomarkers remain to be validated and evaluated for the possibility of application in clinical practices (Fridman et al., 2012; Jiang et al., 2018; McLean & El-Omar, 2014). On one hand, there is still a lack of reliable biomarkers for predicting the prognosis of gastric cancer (Kim et al., 2020; Liu et al., 2020). On the other hand, multiple biomarkers can be integrated into single models to greatly improve the accuracy of prognosis evaluation (Agesen et al., 2012; Jiang et al., 2018; Zhang et al., 2013). Therefore, it is important to identify more biomarkers associated with prognosis of gastric cancer.
However, cross-cohort heterogeneity largely delayed the identification of stable gene signatures associated with prognosis of gastric cancers (Liu et al., 2020; Zhou et al., 2020). To find the more stable STAD-associated gene expression signatures and to build more reliable STAD prognosis-evaluation models, especially predicting the cases of poorest and best prognosis effectively, in this study, we proposed a bi-end stratification based supervised comparison strategy to identify more prognosis-associated genes, trained Cox and machine-learning models, and evaluated their performance in prognosis prediction with multiple STAD cohorts.
Results
More genes with significant expression difference can be identified with a bi-end stratification strategy
For a continuous variable, survival time for instance, single-point stratification cannot assign the cutoff-nearby points accurately since they are of more randomness. The problem can be hypothetically overcome by stratification with the two ends of an interval instead of a single point (Fig. 1A). To test the effect, and to identify the genes whose expression is associated with STAD prognosis, especially with the worst and best survival, we stratified the STAD patients from multiple independent cohorts with both a common-used single-point strategy and the proposed bi-end stratification strategy, followed by supervised comparison of the gene expression between the two prognostic groups.
Fig. 1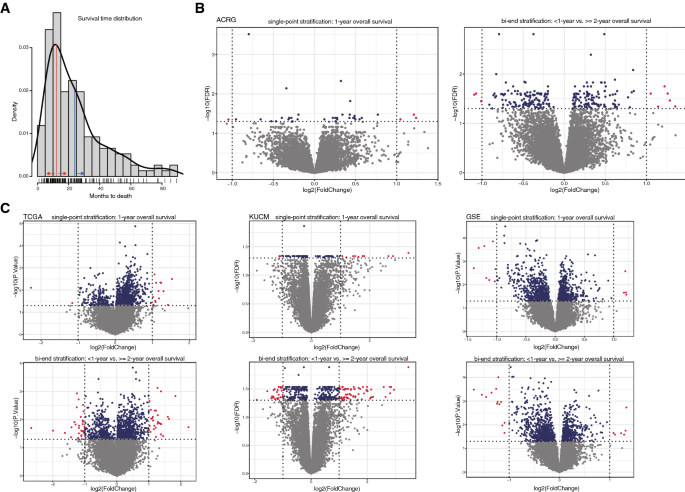
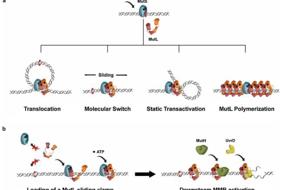
Bi-end stratification and improvement on the sensitivity of its based supervised comparison. A Overall survival distribution of ACRG cases. Single-point stratification was exemplified by ‘1-year’shown in red line and red arrows; bi-end stratification was exemplified by ‘ < 1-year’ and ‘ > 2-year’, the latter of which was shown in blue line and arrow. B–C The significant hits generated by the supervised comparison between groups stratified by single-point or bi-end strategy for ACRG and other STAD cohorts. The points represented the cases, and red ones were those with both between-group significance of < 0.05 and fold change > 2 or < 0.5, while blue ones were only with significance of < 0.05
Full size imageFor the ACRG cohort, only 4 genes were identified with significant expression difference between the cases stratified by 1-year overall survival at FDR < 0.05 and fold change > = 2 (strict). The number of significant genes increased to 35 if fold change was not considered (FDR < 0.05; relaxed). However, the numbers increased to 9 (strict) and 242 (relaxed), respectively, between the cases stratified by two ends of a survival period of 1–2 years (Fig. 1B). The significance was increased generally as the period interval was elongated (Supplemental Fig. S1). Similarly, for the ACRG long-term survival, bi-end stratifications also identified more significant genes with expression difference between groups than those identified with single-point stratifications (Supplemental Fig. S2).
Other STAD cohorts were also used for the evaluation. Bi-end stratification always disclosed more significant genes than sing-point stratification (Fig. 1C).The results suggest that, for continuous variables, interval-based bi-end stratifications and binning can be used for further between-group comparisons and biomarker identification, to identify more significant results than single-value stratifications.
Gene signatures associated with the poorest and best prognosis of STADs
Significantly enriched cancer hallmark gene sets were identified in the poorest prognosis groups for individual cohorts, but common pathways were seldom identified (Fig. 2A). Between-group statistical comparison was also performed to find the poorest prognosis-associated increased-expressed genes (< 1-year vs. > = 2-year overall survival). Only a few significant genes were identified with the strict parameters defined above and they were seldom shared between cohorts. Instead, p values without multiple-test corrections were based and fold changes were not taken into account, so as to find out more candidate genes that could be atypically associated with STAD poorest prognosis. However, there remained very few common significant genes among different datasets, with2among ACRG, TCGA and GSE, and none when another cohort (KUCM) was included additionally (Fig. 2B). Gene set enrichment analysis (GSEA) and statistical comparisons were also performed to screen the best prognosis-associated pathways and genes (> 5-year vs. < = 4-year overall survival). Similarly, there could be significant hits for individual cohorts, but very few were shared (Fig. 2C–D). The results demonstrated that even though bi-end stratification could improve the power of between-group statistical comparison, the heterogeneity among STAD cohorts, as found previously (Zhou et al., 2020), precluded the identification of reliable prognosis-associated gene factors.
Fig. 2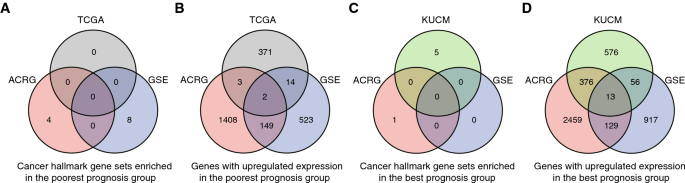
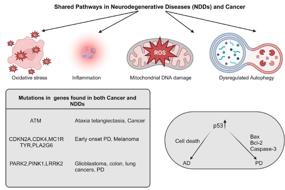
Heterogeneity of different STAD cohorts and the research design. A–D Heterogeneity of different STAD cohorts. Intersect of genes with significant expression up-regulation or cancer hallmark gene sets enriched in the poorest or best prognosis groups in different STAD cohorts
Full size imageTo find reliable biomarker genes that can be used to predict the STAD cases of poorest and best prognosis accurately, a modified procedure was proposed (Fig. 3), by which signature genes were detected in the common set from only two cohorts while prediction models were trained with one of them, followed by model performance evaluation with two other totally independent datasets. In total, 12 genes were identified as signatures associated with the poorest prognosis, while 12 other genes were associated with the best prognosis of STAD cases in the ARCG cohort (Fig. 3).
Fig. 3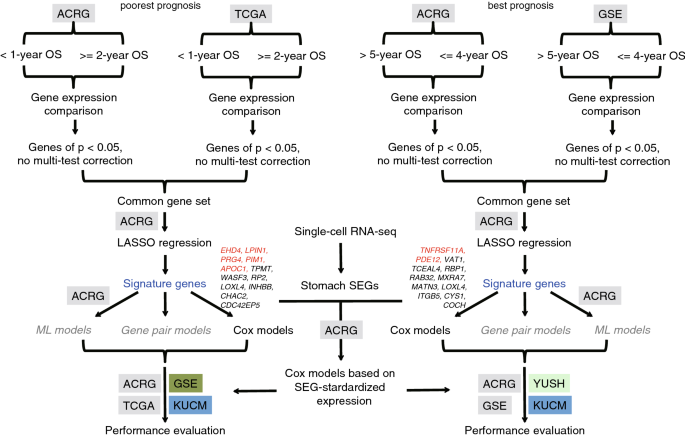
Design of the research to identify and apply the STAD prognosis related gene expression signatures. Signature genes were indicated and the most significant ones were highlighted in red. OS overall survival, ML machine learning
Full size imageThe expression of individual genes was used to stratify STAD cases in each cohort, but no one was found to be stably associated with prognosis among the cohorts despite significant association being identified in individual cohorts. (Supplemental Fig. S3, for the best prognosis-associated gene signatures).
Cox regression models well classify STAD cases of different overall prognosis
To observe whether a combination of the signature genes could be used for prognosis evaluation, Cox models were built on the ACRG dataset with the signature genes associated with poorest or best prognosis of STAD cases, respectively. For the poorest prognostic signatures-based model, the cases of ACRG were classified into two groups according to the relationship between the predicted risk values and the medium cutoff, which showed significant overall survival (Fig. 4A; p < 0.0001, Gehan–Breslow–Wilcoxon test). The model was applied for other independent STAD cohorts, except for YUSH, for which some of the poorest prognosis related signature genes were undetectable in the microarray data. The ACRG-based cox model could well classify GSE and KUCM cases into two groups with significantly different prognosis, respectively (Fig. 4A; p = 0.004 for GSE and 0.0056 for KUCM). However, the model appeared ineffective in stratification of TCGA cases into different prognostic groups, though the signatures were also identified from TCGA data (Fig. 4A; p = 0.72).
Fig. 4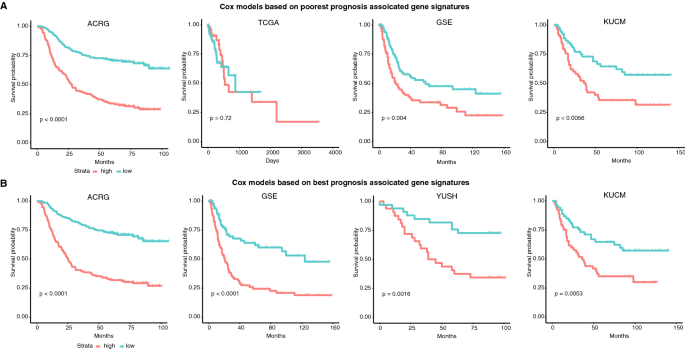
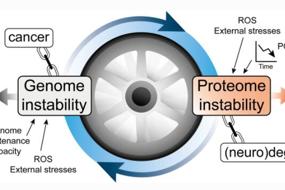
Overall survival difference between case groups classified by the Cox models trained with the ACRG cohort. A Cox model with the 12-gene signatures associated with the poorest prognosis. B Cox model with the 12-gene signatures associated with the best prognosis
Full size imageSimilarly, the ACRG cox model based on best prognosis related signature genes could well classify ACRG and other semi-independent (GSE) or independent (YUSH and KUCM) cases into groups with significantly different overall survival (Fig. 4B; p < 0.0001, < 0.0001, = 0.0016 and 0.0053 for ACRG, GSE, YUSH and KUCM, respectively). For the best prognosis prediction, the TCGA cohort was not tested since no cases were with > 5-year overall survival.
Generally, the results demonstrated that the cox model based on combination of either the poorest or the best prognosis related signature genes could well classify the cases into different prognostic groups. The models showed cross-cohort applicability.
Accurate prediction of poorest and best prognosis STAD cases with cox models based on the signature genes normalized by stably expressed genes
Despite good performance of the cox models in stratification of STAD cases into groups of different prognosis, there remains a challenge in their practical application, since it is difficult to make unbiased quantification for the signature genes in various samples and to set a fixed cutoff to classify the cases according to the model calculation results. To overcome this problem, we proposed an internal reference normalization strategy, by which the raw expression values were normalized by a group of stably expressed genes in stomachs, followed by training the cox models using the normalized expression levels of the signature genes.
Three genes, B2M, EEF1A1 andRPS19, were selected as internal reference genes since they were within the most stably expressed genes among single cells, sub-clusters and different cell types in normal, inflammatory and cancerous stomachs, and they were detected in all the tested STAD cohorts (Methods). Normalized with these reference genes, the expression of ACRG signature genes was used for building the cox models to predict the poorest and the best prognostic cases, respectively. For the ACRG and other independent STAD cohorts except for TCGA, the two new models could still distinguish the groups with better and poorer prognosis (Supplemental Fig. S4). For TCGA, however, the poorest prognosis prediction model could stratify the cases into two groups with marginally different overall survival but the association with model prediction values was contrary to the expectation (Supplementary Fig. S5A; p = 0.11). The best prognosis prediction model could even distinguish two groups from TCGA cases of prognosis with higher significance but still with a reverse association with overall survival (Supplementary Fig. S5B; p = 0.088). It could be due to the data type difference between TCGA and the other datasets rather than the signature heterogeneity among cohorts since the signature genes were also identified from the TCGA dataset with expression difference patterns similar to those in ACRG.A cox model based on the expression of the same list of poorest prognosis-associated genes normalized by the internal reference genes from the TCGA dataset could well classify the TCGA cases into two different prognostic groups (Supplementary Fig. S5C; p = 0.0063); however, the model performance could not be evaluated in other RNA-seq datasets because of the unavailability.
The ACRG-based reference-normalized cox models were used to predict STAD cases with poorest prognosis (< 1-year overall survival) and best prognosis (> 5-year overall survival), respectively. The poorest prognosis prediction model (pCox) could recognized the cases of < 1-year overall survival with rocAUC of 0.792, 0.726 and 0.636 for ACRG, GSE and KUCM cohorts, respectively (Fig. 5A). The best prognosis model (bCox) predicted the cases of > 5-year overall survival with rocAUC of 0.775, 0.737, 0.750 and 0.529 for ACRG, GSE, YUSH and KUCM, respectively (Fig. 5B).With a fixed risk cutoff for either model, e.g., > 2 being considered as poorest prognosis for pCox and < 1 as best prognosis for bCox, the prediction accuracy of pCox reached 0.808, 0.716 and 0.644 for ACRG, GSE and KUCM, while that of bCox reached 0.726, 0.722, 0.707 and 0.518 for ACRG, GSE, YUSH and KUCM, respectively (Fig. 5C–D).Except for the bCox for KUCM, both the models appeared to show good performance in prediction of STAD cases of poorest and best overall survival in multiple cohorts.
Fig. 5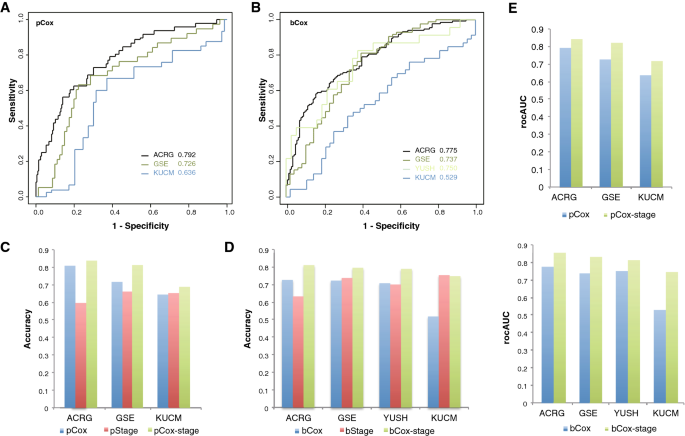
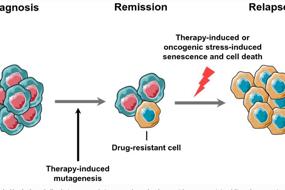
Performance of SEG-based Cox models on prediction of the prognosis of cases in different STAD cohorts. A–B ROC curves of poorest (pCox) and best prognosis (bCox) models predicting the prognosis of different STAD cohorts. C–E Accuracy and rocAUC of the gene signature models with or without stage information in prediction of the prognosis of cases in different STAD cohorts
Full size imagePerformance improvement of the models predicting STAD prognosis with combined features of gene signatures and tumor staging information
Besides the cox models, we also trained machine-learning models, including SVM, RF and Naïve Bayesian ones, with the signature genes featured directly by their expression levels or by relationship between each pair of genes (gene-pair models). However, the machine-learning models did not outperform the pCox or bCox, while the gene-pair models even performed worse though it had higher practical feasibility like SEG-normalized Cox models (data not shown).
We also tested the clinical cofounders, and found that tumor stage was an important factor that could be based on to predict both the shortest (poorest) and the longest (best) prognosis. Solely with stage information, i.e., cases stratified into groups of Stage I/II and Stage III/IV, poorest prognosis cases (< 1-year overall survival) could be predicted with an accuracy of 0.596, 0.661 and 0.652 for ACRG, GSE and KUCM, respectively (Fig. 5C), while best prognosis cases (> 5-year overall survival) were predicted with an accuracy of 0.632, 0.737, 0.7 and 0.753, respectively (Fig. 5D). The performance was close to the two 12-gene Cox models, and even better than the latter for some cohorts.
Two new Cox models, namely pCox-stage and bCox-stage, were thereafter built with a combination of the signature genes and stage information, also using the ACRG data. Both pCox-stage and bCox-stage reached apparently higher rocAUC than pCox and bCox, respectively, in individual cohorts (Fig. 5E). With fixed cutoffs same with those for pCox and bCox, pCox-stage outperformed both pCox and the stage model in ACRG, GSE and KUCM, with an accuracy of 0.837, 0.812 and 0.688, respectively (Fig. 5C). Similarly, bCox-stage also outperformed bCox and the corresponding stage model in ACRG, GSE, YUSH and KUCM, with an accuracy of 0.810, 0.795, 0.789 and 0.747, respectively (Fig. 5D).
Discussion
There is large genetic heterogeneity in gastric cancers, which could be originated from multiple factors, such as ethnicity, anatomical sites, histology and pathology, etc. Findings from one cohort are often unable to be repeatedly identified from another cohort (Liu et al., 2020; Zhou et al., 2020). The direct influence is that, till now, very few effective genetic biomarkers have been identified for diagnosis or treatment of gastric cancers.
Gene expression was profiled at genome wide for multiple STAD cohorts. Genes whose expression is associated cancer prognosis can be identified theoretically by screening of differentially expressed genes between the groups of different prognosis. One of the most frequently adopted stratification strategy on prognosis remains to calculate the medium survival time and to divide the cases into two groups according to the relationship between the survival of individual cases and the medium survival time, although survival information was considered a continuous variable with right-censoring in nature and dichotomizing response variable might lead to suboptimal results (Altman & Royston, 2006; Royston et al., 2006). In this study, we proposed a bi-end stratification strategy and demonstrated its advantages over the single-point strategy in finding more genes with significant expression difference more accurately (Fig. 1).Despite the improvement of power in finding prognosis-associated genes from a same dataset, we still found that the heterogeneity from cohort to cohort was apparent, and cross-cohort common prognosis-associated genes (Fig. 2B, D), pathways (Fig. 2A, C), or immune cell types in tumor microenvironment (data not shown) were hardly identified. Tumors could have different subtypes or major composition cell clusters associated with prognosis (Cancer Genome Atlas Research Network, 2014; Li et al., 2020). Cases from different cohorts and stratified based on the ‘bi-end’ strategy could be cofounded by enrichment of certain subtypes or tumor cell clusters, causing the inconsistence among cohorts. More future work is required to exclude or confirm the possibility, which would facilitate our understanding on the underlying mechanisms of STAD heterogeneity.
To overcome the cross-cohort heterogeneity problem, we relaxed the standard for screening prognosis-associated genes in individual cohorts and sought the common sets as more cross-cohort stable ones. With the procedure, other feature selection strategies such as LASSO regression, and Cox model integrating the multiple signature genes, we identified 12/12 genes whose expression were generally associated with the poorest/best prognosis of STAD in the training cohorts, semi-independent cohorts and independent cohorts (Fig. 4). The model was not effective in TCGA cohort though the gene signatures were also identified from the latter. The ineffectiveness could be due to the difference of data types since TCGA dataset is the only RNA-seq data type. Other factors may also have contributed to the heterogeneity. For example, a majority of the TCGA cases were not Asian while most of the cases from the other cohorts used in this study were from Asia.
Although the gene signatures showed association with STAD prognosis and the Cox models could classify the cases of different cohorts into groups with significantly different overall survival, there remained practical limitations. A major problem is the quantification of the signature genes and the inputs in the Cox models. The quantification of the gene expression should be normalized to the same scale in practice. To solve the problem, in the first place, we identified three stably expressed genes in the mucosa tissues of normal and diseased stomachs according to published stomach single-cell RNA-seq datasets (Methods; http://61.160.194.165:3080/hSEGdb). Using the genes as internal references, the expression of signature genes could be normalized to the same scale for individual patients of each cohort. The new Cox models based on the normalized expression of the signature genes could be applied in practice, and for each case, 3 additional SEGs need to be quantified besides the signature genes. Generally, new Cox models could still predict the cases of poorest and best prognosis, though it seemed that they might not work as effectively as the SEG non-normalized ones in some cohorts (Fig. S5; Fig. 5A–B).
TNM staging remains the most frequently used method clinically to evaluate the prognosis of STAD and other tumors. For the cohorts studied in this study, we did find an association between the STAD stages and the prognosis (Fig. 5C–D). Interestingly, combination of the stage information and the gene signatures could apparently improve the performance of models in predicting STAD cases of poorest and best prognosis (Fig. 5E), also suggesting the independent contribution of both the gene signatures and stage information, and the positive synergistic effect between them in prognosis prediction.
Besides Cox models, we also tested the individual signature gene based and more practically useful gene pair-based machine-learning models. However, the models did not show superior performance. It should be noted that the signature genes used for the machine-learning models were the same ones for the Cox models after LASSO selection. Other strategies, such as mRMR (Peng et al., 2005), might be more suitable for the selection of features for machine-learning models, and should be tested in future studies. Like the SEG-normalized quantification strategy used for Cox model building, gene pair-based machine-learning models can also overcome the practical problem of standardized gene quantification, feature representation and model application (Li et al., 2017). Previously, others and we also demonstrated other types of biomarkers for gastric cancer, such as germline or somatic mutation signatures (Li et al., 2018; Liu et al., 2020), isoform or allele-specific isoforms (Hu et al., 2020), immune cell types (Li et al., 2020), etc., which could be associated with tumor progress or prognosis as independent contributing factors. Combination of these multiple types of signatures could possibly achieve better performance in prediction of the prognosis of patients with gastric cancer.
In summary, in this study, we proposed an integrated pipeline to identify STAD prognosis-associated gene expression signatures, and to train the practically applicable prediction models. We also identified two lists of gene signatures, which could be used for prediction of STAD cases of poorest and best prognosis effectively, especially in combination with tumor stage information.
Materials and methods
Gene expression datasets and clinical data
Four microarray-based gene expression datasets and one RNA-seq dataset (TCGA) for STAD cases were used in this study. The datasets were used since they are publically available together with the clinical data. Both microarray and RNA-seq datasets were used so that we could observe the effect of different data types. The raw microarray datasets were downloaded from NCBI Gene Expression Omnibus (GEO) database, and the accessions included GSE62254 (ACRG), GSE15459 (GSE), GSE26901 (KUCM), and GSE13861 (YUSH) (Cho et al., 2011; Cristescu et al., 2015; Oh et al., 2018; Ooi et al., 2009). The clinical data were also downloaded from the corresponding publications. The TCGA read count data and clinical data were both downloaded from the TCGA data portal site (http://cancergenome.nih.gov/).
Data pre-processing, filtering and differential expression analysis
Raw microarray-based gene expression ‘CEL’ files were loaded with an R package ‘affy’ and normalized with ‘rma’. Genes were annotated, filtered and compared for the expression between groups according to the standard protocol for microarray-based gene expression data analysis (Sun et al., 2018). The TCGA RNA-seq dataset was loaded to ‘edgeR’, normalized and compared for the gene expression (Robinson & Smyth, 2007).Gene set enrichment analysis (GSEA) was also performed to the datasets stratified by indicated survival cutoffs (Subramanian et al., 2005).
Single-point and bi-end stratification
A continuous feature variable can be used for bi-stratification of the samples with a single-point cutoff, C. A sample is classified into one group if the feature variable is of a value not larger than C, or classified into the other group if the value is larger than C. To reduce the influence of ambiguous classification of samples with feature values around the single-point cutoff, bi-end stratification is proposed in the study, by which two cutoffs, C1 and C2 (C1 < C2), is preset, and the samples are stratified according to the values of studied feature variable, group 1 if < = C1 and group 2 if > C2. For the bi-end stratification, the ‘ambiguous’ samples that are with feature values located between C1 and C2 are neglected.
Survival analysis
Kaplan–Meier overall survival analysis was performed with theR package ‘survival’. Gehan–Breslow–Wilcoxon tests were used to evaluate the survival difference between different groups. Statistic alpha value was preset as 0.05.
LASSO regression and cox models
The most informative prognostic gene signatures were selected with Least Absolute Shrinkage and Selection Operator (LASSO) regression models, which use a penalty parameter l to shrink some regression coefficients to exactly zero in order to control the number of predictors selected (Tibshirani, 1997; Robert Tibshirani, 2011). Cox regression models were built to predict the risks with the features selected by LASSO regression analysis. The R package, ‘glmnet’ was used to perform LASSO and Cox regression analysis.
Feature representation by SEG normalization and relative expression between paired genes
For Cox regression models, a reference-based normalization strategy was proposed for practical application use. Three Stable Expression Genes (SEGs), i.e., B2M, EEF1A1 and RPS19, were identified with invariable expression among single cells within healthy, inflammatory and cancerous human stomach mucosa tissues. For each microarray or RNA-seq data, the expression of signature genes were normalized by the reference SEGs, that is, to calculate the average logarithm of relative expression of each signature gene to the SEGs. The normalized expression values of signature genes were used for model training and model application. For machine-learning models, we adopted gene-pair relative expression scheme for feature representation of signature genes. Specifically, within each cohort, for each pair of the signature genes, A and B, for example, if the expression level of A is not larger than B, the new gene-pair feature was assigned with a value ‘1’, and ‘0’ otherwise. Each sample was encoded with a value vector of the new signature gene-pair features. In practice, the gene-pair feature representation is also feasible, being independent of the specific expression values.
Machine learning models
Naïve Bayes (NB) models, Random Forest (RF) models and Support Vector Machine (SVM) models were trained in the study to predict the prognosis of STAD cases with the expression of signature genes. NB and SVM models were trained with the R package ‘e1071’, while ‘randomForest’ was used to build RF models. For SVM models, the four kernels, ‘rbf’, ‘linear’, ‘sigmoid’ and ‘polynomial’, and the parameters (cost and/or gamma) were optimized with tenfold cross-validation grid searching strategy. The ACRG cohort was used as the training dataset, while the others were served as validation datasets.
Model performance evaluation
Survival prediction models were evaluated with Receiver Operating Characteristic (ROC) curves, the Area Under the ROC Curves (rocAUCs), Accuracy, Specificity and Sensitivity. An ROC curve is a plot of Sensitivity versus (1–Specificity) and is generated by shifting the decision threshold. AUC gives a measure of classifier performance. The other parameters are defined as,
Accuracy=(TP+TN)/(TP+FP+TN+FN),Specificity=TN/(TN+FP),Sensitivity=TP/(TP+FN),where TP, TN, FP, FN represent true positives, true negatives, false positives and false negatives, respectively.
Data availability
All data generated or analyzed during this study are included in this manuscript. Materials described in this manuscript are available upon request.
References
Abnet, C. C., Freedman, N. D., Hu, N., Wang, Z., Yu, K., Shu, X. O., & Taylor, P. R. (2010). A shared susceptibility locus in PLCE1 at 10q23 for gastric adenocarcinoma and esophageal squamous cell carcinoma. Nature Genetics, 42(9), 764–767. https://doi.org/10.1038/ng.649
Agesen, T. H., Sveen, A., Merok, M. A., Lind, G. E., Nesbakken, A., Skotheim, R. I., & Lothe, R. A. (2012). ColoGuideEx: A robust gene classifier specific for stage II colorectal cancer prognosis. Gut, 61(11), 1560–1567. https://doi.org/10.1136/gutjnl-2011-301179
Altman, D. G., & Royston, P. (2006). The cost of dichotomising continuous variables. BMJ, 332(7549), 1080.
American Cancer Society, (2022). Stomach Cancer Survival Rates. https://www.cancer.org/cancer/stomach-cancer/detection-diagnosis-staging/survival-rates.html)
Boussioutas, A., Li, H., Liu, J., Waring, P., Lade, S., Holloway, A. J., & Bowtell, D. D. (2003). Distinctive patterns of gene expression in premalignant gastric mucosa and gastric cancer. Cancer Research, 63(10), 2569–2577.
Bray, F., Ferlay, J., Soerjomataram, I., Siegel, R. L., Torre, L. A., & Jemal, A. (2018). Global cancer statistics 2018: GLOBOCAN estimates of incidence and mortality worldwide for 36 cancers in 185 countries. CA: A Cancer Journal for Clinicians, 68(6), 394–424. https://doi.org/10.3322/caac.21492
Cancer Genome Atlas Research Network. (2014). Comprehensive molecular characterization of gastric adenocarcinoma. Nature, 513(7517), 202–209. https://doi.org/10.1038/nature13480
Cho, J. H., Lim, J. Y., & Cho, J. Y. (2017). Comparison of capecitabine and oxaliplatin with S-1 as adjuvant chemotherapy in stage III gastric cancer after D2 gastrectomy. PLoS One, 12(10), e0186362. https://doi.org/10.1371/journal.pone.0186362
Cho, J. Y., Lim, J. Y., Cheong, J. H., Park, Y. Y., Yoon, S. L., Kim, S. M., & Lee, J. S. (2011). Gene expression signature-based prognostic risk score in gastric cancer. Clinical Cancer Research, 17(7), 1850–1857. https://doi.org/10.1158/1078-0432.CCR-10-2180
Cristescu, R., Lee, J., Nebozhyn, M., Kim, K. M., Ting, J. C., Wong, S. S., & Aggarwal, A. (2015). Molecular analysis of gastric cancer identifies subtypes associated with distinct clinical outcomes. Nature Medicine, 21(5), 449–456. https://doi.org/10.1038/nm.3850
Fang, H., Li, R., Gu, Y., Fei, Y., Jin, K., Chen, Y., & Shen, Z. (2020). Intratumoral interleukin-9 delineates a distinct immunogenic class of gastric cancer patients with better prognosis and adjuvant chemotherapeutic response. Oncoimmunology, 9(1), 1856468. https://doi.org/10.1080/2162402X.2020.1856468
Ferlay, J., Shin, H. R., Bray, F., Forman, D., Mathers, C., & Parkin, D. M. (2010). Estimates of worldwide burden of cancer in 2008: GLOBOCAN 2008. International Journal of Cancer, 127(12), 2893–2917. https://doi.org/10.1002/ijc.25516
Fridman, W. H., Pages, F., Sautes-Fridman, C., & Galon, J. (2012). The immune contexture in human tumours: Impact on clinical outcome. Nature Reviews Cancer, 12(4), 298–306. https://doi.org/10.1038/nrc3245
Hu, Y., Shu, X. S., Yu, J., Sun, M. A., Chen, Z., Liu, X., Fang, Q., Zhang, W., Hui, X., Ying, Y., Fu, L., Lu, D., Kumar, R., & Wang, Y. (2020). Improving the diversity of captured full-length isoforms using a normalized single-molecule RNA-sequencing method. Commun Biol, 3(1), 403. https://doi.org/10.1038/s42003-020-01125-7
IARC monographs on the evaluation of carcinogenic risks to humans. Ingested nitrate and nitrite, and cyanobacterial peptide toxins. (2010) IARC Monogr Eval Carcinog Risks Hum, 94 (v–vii), 1–412
Isobe, Y., Nashimoto, A., Akazawa, K., Oda, I., Hayashi, K., Miyashiro, I., & Kaminishi, M. (2011). Gastric cancer treatment in Japan: 2008 annual report of the JGCA nationwide registry. Gastric Cancer, 14(4), 301–316. https://doi.org/10.1007/s10120-011-0085-6
Jiang, Y., Zhang, Q., Hu, Y., Li, T., Yu, J., Zhao, L., & Qi, X. (2018). ImmunoScore signature: a prognostic and predictive tool in gastric cancer. Annals of Surgery, 267(3), 504–513. https://doi.org/10.1097/SLA.0000000000002116
Kamangar, F., Dores, G. M., & Anderson, W. F. (2006). Patterns of cancer incidence, mortality, and prevalence across five continents: Defining priorities to reduce cancer disparities in different geographic regions of the world. Journal of Clinical Oncology, 24(14), 2137–2150. https://doi.org/10.1200/JCO.2005.05.2308
Kamangar, F., Sheikhattari, P., & Mohebtash, M. (2011). Helicobacter pylori and its effects on human health and disease. Arch Iran Med, 14(3), 192–199.
Karimi, P., Islami, F., Anandasabapathy, S., Freedman, N. D., & Kamangar, F. (2014). Gastric cancer: Descriptive epidemiology, risk factors, screening, and prevention. Cancer Epidemiology, Biomarkers & Prevention, 23(5), 700–713. https://doi.org/10.1158/1055-9965.EPI-13-1057
Kim, S. K., Kim, H. J., Park, J. L., Heo, H., Kim, S. Y., Lee, S. I., & Kim, Y. S. (2020). Identification of a molecular signature of prognostic subtypes in diffuse-type gastric cancer. Gastric Cancer, 23(3), 473–482. https://doi.org/10.1007/s10120-019-01029-4
Lei, Z., Tan, I. B., Das, K., Deng, N., Zouridis, H., Pattison, S., & Rozen, S. G. (2013). Identification of molecular subtypes of gastric cancer with different responses to PI3-kinase inhibitors and 5-fluorouracil. Gastroenterology, 145(3), 554–565. https://doi.org/10.1053/j.gastro.2013.05.010
Li, B., Cui, Y., Diehn, M., & Li, R. (2017). Development and validation of an individualized immune prognostic signature in early-stage nonsquamous non-small cell lung cancer. JAMA Oncology, 3(11), 1529–1537.
Li, B., Jiang, Y., Li, G., Fisher, G. A., Jr., & Li, R. (2020). Natural killer cell and stroma abundance are independently prognostic and predict gastric cancer chemotherapy benefit. JCI Insight, 5(9), e136570.
Li, X., Pasche, B., Zhang, W., & Chen, K. (2018). Association of MUC16 mutation with tumor mutation load and outcomes in patients with gastric Cancer. JAMA Oncology, 4, 1691–1698.
Liu, X., Hui, X., Kang, H., Fang, Q., Chen, A., Hu, Y., & Wang, Y. (2020). A multi-gene model effectively predicts the overall prognosis of stomach adenocarcinomas with large genetic heterogeneity using somatic mutation features. Frontiers in Genetics, 11, 940. https://doi.org/10.3389/fgene.2020.00940
McLean, M. H., & El-Omar, E. M. (2014). Genetics of gastric cancer. Nature Reviews. Gastroenterology & Hepatology, 11(11), 664–674. https://doi.org/10.1038/nrgastro.2014.143
Ni, X., Tan, Z., Ding, C., Zhang, C., Song, L., Yang, S., & Qin, J. (2019). A region-resolved mucosa proteome of the human stomach. Nature Communications, 10(1), 39. https://doi.org/10.1038/s41467-018-07960-x
Noh, S. H., Park, S. R., Yang, H. K., Chung, H. C., Chung, I. J., Kim, S. W., Investigators, Classic trial. (2014). Adjuvant capecitabine plus oxaliplatin for gastric cancer after D2 gastrectomy (CLASSIC): 5-year follow-up of an open-label, randomised phase 3 trial. Lancet Oncol, 15(12), 1389–1396. https://doi.org/10.1016/S1470-2045(14)70473-5
Oh, S. C., Sohn, B. H., Cheong, J. H., Kim, S. B., Lee, J. E., Park, K. C., & Lee, J. S. (2018). Clinical and genomic landscape of gastric cancer with a mesenchymal phenotype. Nature Communications, 9(1), 1777. https://doi.org/10.1038/s41467-018-04179-8
Ooi, C. H., Ivanova, T., Wu, J., Lee, M., Tan, I. B., Tao, J., & Tan, P. (2009). Oncogenic pathway combinations predict clinical prognosis in gastric cancer. PLoS Genetics, 5(10), e1000676. https://doi.org/10.1371/journal.pgen.1000676
Ooi, W. F., Xing, M., Xu, C., Yao, X., Ramlee, M. K., Lim, M. C., & Tan, P. (2016). Epigenomic profiling of primary gastric adenocarcinoma reveals super-enhancer heterogeneity. Nature Communications, 7, 12983. https://doi.org/10.1038/ncomms12983
Peng, H., Long, F., & Ding, C. (2005). Feature selection based on mutual information: Criteria of max-dependency, max-relevance, and min-redundancy. IEEE Transactions on Pattern Analysis and Machine Intelligence, 27(8), 1226–1238. https://doi.org/10.1109/TPAMI.2005.159
Robinson, M. D., & Smyth, G. K. (2007). Moderated statistical tests for assessing differences in tag abundance. Bioinformatics, 23(21), 2881–2887. https://doi.org/10.1093/bioinformatics/btm453
Royston, P., Altman, D. G., & Sauerbrei, W. (2006). Dichotomizing continuous predictors in multiple regression: A bad idea. Statistics in Medicine, 25(1), 127–141.
Sakamoto, H., Yoshimura, K., Saeki, N., Katai, H., Shimoda, T., Hirohashi, S., Study Group of Millennium Genome Project for, Cancer. (2008). Genetic variation in PSCA is associated with susceptibility to diffuse-type gastric cancer. Nat Genet, 40(6), 730–740. https://doi.org/10.1038/ng.152
Sakuramoto, S., Sasako, M., Yamaguchi, T., Kinoshita, T., Fujii, M., Nashimoto, A., Group, Acts-Gc. (2007). Adjuvant chemotherapy for gastric cancer with S-1, an oral fluoropyrimidine. N Engl J Med, 357(18), 1810–1820. https://doi.org/10.1056/NEJMoa072252
Sasako, M., Inoue, M., Lin, J. T., Khor, C., Yang, H. K., & Ohtsu, A. (2010). Gastric cancer working group report. Japanese Journal of Clinical Oncology, 40(Suppl 1), i28-37. https://doi.org/10.1093/jjco/hyq124
Shi, Y., Hu, Z., Wu, C., Dai, J., Li, H., Dong, J., & Shen, H. (2011). A genome-wide association study identifies new susceptibility loci for non-cardia gastric cancer at 3q13.31 and 5p13.1. Nat Genet, 43(12), 1215–1218. https://doi.org/10.1038/ng.978
Siegel, R., Ma, J., Zou, Z., & Jemal, A. (2014). Cancer statistics, 2014. CA: A Cancer Journal for Clinicians, 64(1), 9–29. https://doi.org/10.3322/caac.21208
Siegel, R. L., Miller, K. D., & Jemal, A. (2020). Cancer statistics, 2020. CA: A Cancer Journal for Clinicians, 70(1), 7–30. https://doi.org/10.3322/caac.21590
Subramanian, A., Tamayo, P., Mootha, V. K., Mukherjee, S., Ebert, B. L., Gillette, M. A., & Mesirov, J. P. (2005). Gene set enrichment analysis: A knowledge-based approach for interpreting genome-wide expression profiles. Proc Natl Acad Sci USA, 102(43), 15545–15550. https://doi.org/10.1073/pnas.0506580102
Sun, M. A., Shao, X., & Wang, Y. (2018). Microarray data analysis for transcriptome profiling. Methods in Molecular Biology, 1751, 17–33. https://doi.org/10.1007/978-1-4939-7710-9_2
Tan, I. B., Ivanova, T., Lim, K. H., Ong, C. W., Deng, N., Lee, J., & Tan, P. (2011). Intrinsic subtypes of gastric cancer, based on gene expression pattern, predict survival and respond differently to chemotherapy. Gastroenterology, 141(2), 476–485. https://doi.org/10.1053/j.gastro.2011.04.042 e471-411.
Tibshirani, R. (1997). The lasso method for variable selection in the cox model. Statistics in Medicine, 16(4), 385–395. https://doi.org/10.1002/(sici)1097-0258(19970228)16:4%3c385::aid-sim380%3e3.0.co;2-3
Tibshirani, R. (2011). Regression shrinkage and selection via the lasso: A retrospective. Journal of the Royal Statistical Society, 73(3), 273–282. https://doi.org/10.1111/j.1467-9868.2011.00771.x
Tsugane, S., Sasazuki, S., Kobayashi, M., & Sasaki, S. (2004). Salt and salted food intake and subsequent risk of gastric cancer among middle-aged Japanese men and women. British Journal of Cancer, 90(1), 128–134. https://doi.org/10.1038/sj.bjc.6601511
Van Cutsem, E., Sagaert, X., Topal, B., Haustermans, K., & Prenen, H. (2016). Gastric cancer. Lancet, 388(10060), 2654–2664. https://doi.org/10.1016/S0140-6736(16)30354-3
Wang, L. D., Zhou, F. Y., Li, X. M., Sun, L. D., Song, X., Jin, Y., & Zhang, X. J. (2010). Genome-wide association study of esophageal squamous cell carcinoma in Chinese subjects identifies susceptibility loci at PLCE1 and C20orf54. Nature Genetics, 42(9), 759–763. https://doi.org/10.1038/ng.648
Zhang, J. X., Song, W., Chen, Z. H., Wei, J. H., Liao, Y. J., Lei, J., & Luo, J. H. (2013). Prognostic and predictive value of a microRNA signature in stage II colon cancer: A microRNA expression analysis. The Lancet Oncology, 14(13), 1295–1306. https://doi.org/10.1016/S1470-2045(13)70491-1
Zhang, P., Yang, M., Zhang, Y., Xiao, S., Lai, X., Tan, A., & Li, S. (2019). Dissecting the single-cell transcriptome network underlying gastric premalignant lesions and early gastric cancer. Cell Rep, 27(6), 1934–1947. https://doi.org/10.1016/j.celrep.2019.04.052 e1935.
Zhou, Y. J., Zhu, G. Q., Lu, X. F., Zheng, K. I., Wang, Q. W., Chen, J. N., & Li, X. B. (2020). Identification and validation of tumour microenvironment-based immune molecular subgroups for gastric cancer: Immunotherapeutic implications. Cancer Immunology, Immunotherapy, 69(6), 1057–1069. https://doi.org/10.1007/s00262-020-02525-8
Acknowledgements
This work was supported by a High-level University Construction Project of Shenzhen University; fund for Youth Innovation Team of Shenzhen University (no. 406/0000080805); Natural Science Fund of Shenzhen (JCYJ20190808165205582, JCYJ20170818141120342); Fund for the Cultivation of Guangdong College Students’ Scientific and Technological Innovation, Climbing Program (pdjh2021b0431); Guangdong Provincial Undergraduate Training Program of China for Innovation and Entrepreneurship (S202010590062); National Natural Science Foundation of China (NFSC81773939).
Author information
Authors and Affiliations
Guangdong Key Laboratory of Genome Instability and Human Disease Prevention, Department of Biochemistry and Molecular Biology, Shenzhen University School of Medicine, Shenzhen, 518060, China
Lingyu Qiu & Wei-Guo Zhu
Youth Innovation Team of Medical Bioinformatics, Shenzhen University Health Science Center, Shenzhen, 518060, China
Huayu Kang, Jielin Yang, Yidong Zheng, Aiyue Chen, Chunlin Chen, Xinlong Wang & Yejun Wang
International Cancer Center, Shenzhen University School of Medicine, Shenzhen, 518060, China
Wei-Guo Zhu
Shenzhen Bay Laboratory, Shenzhen University School of Medicine, Shenzhen, 518060, China
Wei-Guo Zhu
School of Stomatology, Shenzhen University Health Science Center, Shenzhen, 518060, China
Ou Sha
Department of Medical Oncology, The First Hospital Affiliated to Shenzhen University, Shenzhen, China
Qiongfang Fang
Contributions
YW, WGZ and OS conceived and supervised the project. LQ, YZ, JY, HK, AC, CC, XW and QF collected the data. LQ, YZ, JY, HK, AC, CC, XW, QF and YW performed the analysis. YZ, JY, HK, CC, XW and YW developed the models. LQ, YZ, HK, AC, CC, YW, OS and WGZ drafted the first version of manuscript. All the authors read, revised and approved the final version of manuscript.
Corresponding authors
Correspondence to Ou Sha or Yejun Wang.
Ethics declarations
Conflict of interest
The authors do not have any conflict of interest or competing interest. Wei-Guo Zhu is an editor for the journal.
Consent for publication
All authors have approved the final submission and consented to publication.
Supplementary Information
Below is the link to the electronic supplementary material.
42764_2022_77_MOESM1_ESM.tif
Supplementary file1 Improved sensitivity for elongated interval between the two stratification ends. The points represented the cases, and red ones were those with both between-group significance of < 0.05 and fold change > 2 or < 0.5, while blue ones were only with significance of < 0.05. (TIF 3497 KB)
42764_2022_77_MOESM2_ESM.tif
Supplementary file2 Increased long-term survival associated gene signatures identified by bi-end stratification in ACRG cohort. (TIF 2802 KB)
42764_2022_77_MOESM3_ESM.tif
Supplementary file3 Overall survival difference between groups classified according to the expression of individual best prognosis-associated genes. The survival time is counted as months. (TIF 13365 KB)
42764_2022_77_MOESM4_ESM.tif
Supplementary file4 Overall survival difference between case groups of different cohorts classified by ACRG SEG-referenced Cox models. (TIF 23279 KB)
42764_2022_77_MOESM5_ESM.tif
Supplementary file5 Overall survival difference between TCGA case groups classified by SEG-referenced models. (TIF 12335 KB)
Rights and permissions
Springer Nature or its licensor holds exclusive rights to this article under a publishing agreement with the author(s) or other rightsholder(s); author self-archiving of the accepted manuscript version of this article is solely governed by the terms of such publishing agreement and applicable law.
About this article
Cite this article
Qiu, L., Kang, H., Yang, J. et al. Accurate prediction of stomach adenocarcinomas of poorest and best prognosis with a combination of gene expression and clinical signatures. GENOME INSTAB. DIS. 3, 227–237 (2022). https://doi.org/10.1007/s42764-022-00077-y
Received03 June 2022
Revised27 July 2022
Accepted29 July 2022
Published19 August 2022
Issue DateOctober 2022
DOIhttps://doi.org/10.1007/s42764-022-00077-y
Share this article
Anyone you share the following link with will be able to read this content:
Get shareable linkKeywords
Stomach adenocarcinoma
Prognosis
Gene expression signature
Prediction
Bi-end stratification
用户登录
还没有账号?
立即注册