Pan-cancer pseudogene RNA analysis reveals a regulatory network promoting cancer cell proliferation
Original Research Paper
Mengbiao Guo, Jingkai Zhang, Qiaoling Liang, Jianxi Zhu, Qi Wang, Zhengwen Fang, Zhou Songyang & Yuanyan Xiong
Genome Instability & Disease 4, 85–97 (2023)
Abstract
Pseudogenes have long been thought to be nonfunctional due to their lack of protein-coding ability, compared to protein-coding genes (PCG). Actually, pseudogenes can transcribe functional long non-coding RNAs (lncRNAs) involved in cancer development and progression. These lncRNAs may regulate mRNA levels as competing endogenous RNAs (ceRNAs). However, a systematic pan-cancer analysis of pseudogene ceRNA networks is still lacking. Here, we curated 9455 pseudogenes and constructed ceRNA networks for 14 cancer types. We discovered that pseudogenes in ceRNA networks were the most cancer type-specific and that ~ 20% cePCGs were cancer hallmark genes, supporting the close relationship between pseudogenes and cancer. Notably, in breast cancer (BRCA), we found that the ceRNA subnetwork of ZNF252P/AL390726.5 (pseudogenes)-miRNAs-ESR1 may enhance the proto-oncogene MYC and we experimentally validated oncogenic effects of the two pseudogenes. Moreover, pseudogene-based subtyping of BRCA tumors revealed a new subtype featured by immunoglobulin pseudogenes. Collectively, our findings could pave the way for more pseudogene research in cancer. We provided our results in a user-friendly database, cePseudo, available at http://bioinfo-sysu.com/cePseudo2.
Introduction
Cancer causes around one sixth deaths worldwide in 2020 (Sung et al., 2021). Despite continuous advancement of cancer research, mechanisms behind many cancers are still elusive (Hanahan, 2022). To tackle this problem, it is important to consider all factors in the human genome, which contains a great number of pseudogenes that have been long overlooked due to mainly their lack of protein-coding ability (Balakirev & Ayala, 2003) or instability of translational products (Brosch et al., 2011; Ji et al., 2015; Poursani et al., 2016) (with exceptions such as POU5F1B (Hayashi et al., 2015)), when compared to their parental genes (Cheetham et al., 2020; Pink et al., 2011).
Recent research showed widespread expression of pseudogenes involved in cancer development (Kalyana-Sundaram et al., 2012). However, except for several pseudogenes, such as PTENP1, BRAFP1, and POU5F1B (Hayashi et al., 2015; Karreth et al., 2015; Poliseno et al., 2010), the functions of the majority of pseudogenes are unknown. Pseudogenes may transcribe long noncoding RNAs (lncRNAs), encode small peptides, or disrupt DNA interaction or sequences of parental genes, to participate in biological processes (Cheetham et al., 2020). Pseudogene lncRNAs can act as competitive endogenous RNAs (ceRNAs) (Salmena et al., 2011) to regulate different mRNAs (Gao et al., 2017; Tian et al., 2020), by competing for the same set of miRNAs binding to mRNAs. However, a systematic pan-cancer survey of pseudogene-centered ceRNA networks and pseudogene functions is still lacking, despite previous studies of specific pseudogenes in a small number of cancers (Han et al., 2014; Kalyana-Sundaram et al., 2012) or ceRNA networks focused on general lncRNAs (Zhang et al., 2016) or parental-pseudogenes (Li et al., 2014; Zheng et al., 2018).
Estrogen receptors, such as ESR1, are closely related to breast cancer development (Robinson et al., 2013). On the other hand, miR-17 family members have well-known roles in tumor suppression. For example, miR-17 members were involved in inhibiting cancer drivers in 15 types of epithelial cancers (Dhawan et al., 2018) and miR-17-5p prevented metastasis of basal-like breast cancer (Fan et al., 2014). Moreover, miR-17-5p, together with miR-93-5p, suppressed tumor cells by inhibiting transcription of the proto-oncogene MYC, which in turn induced expression of the two miRNAs, forming a feedback loop (Aguda et al., 2008). MYC amplification is common in breast cancer and is associated with a poor prognosis (Deming et al., 2000). Moreover, MYC is estrogen-responsive and is regulated by a distal enhancer that is bound by ESR1 and other cofactors that promote long-range chromatin looping (Wang et al., 2011). Therefore, it is possible that pseudogenes may regulate MYC via ceRNA networks involving pseudogenes, ESR1, and miRNAs.
To investigate pseudogene ceRNA networks and possible pseudogene mechanisms in cancer, we integrated multi-omics datasets from various cancer types (n = 19, The Cancer Genome Atlas project [TCGA]) and corresponding healthy tissues from the Genotype-Tissue Expression project (GTEx). A total of 11,501 RNA-seq samples were examined and the expression levels of 1855 pseudogenes were consistently detected across cancers or tissues. We built pseudogene ceRNA networks for 14 cancer types. We then comprehensively investigated the potential functions of pseudogenes across cancers. Importantly, we experimentally validated our findings in breast cancer that pseudogenes regulated ESR1 and MYC within a ceRNA subnetwork. This research can serve as a basis for further understanding of the roles of pseudogenes in cancer, as well as for developing new pseudogene-based biomarkers and therapeutic targets.
Results
Overview of pseudogene expression across cancer types
First of all, we build a confident reference set of 9,455 pseudogenes, composed of 23,832 pseudogene-specific exons (similarity < 0.95) (see Methods). After quantifying these pseudogenes in TCGA (19 cancer types) and GTEx (14 normal tissues) samples (Table S1), we further identified detectable pseudogenes (Han et al., 2014) (FPKM ≥ 0.3, Fig. 1A) for downstream analysis, which differ from overall pseudogenes and protein-coding genes (PCG) in expression levels (Fig. 1B) and sequence conservation (Fig. 1C). Next, for each cancer type, we compared tumor samples with noncancerous samples to obtain differentially expressed PCGs (DEPCG), pseudogenes (DEpseudogene), and miRNAs (DEmiRNA) (Fig. 1D, Table S2). DEpseudogenes showed similar expression levels and normal tissue specificity to detectable pseudogenes (Fig. 1E), but different cancer type specificity (Fig. 1F). In contrast, DEpseudogenes differ from PCGs in normal tissue specificity and, to a lesser degree in cancer type specificity. These results lend support to the biological roles of pseudogenes.
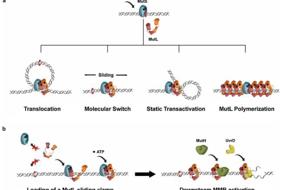
Fig. 1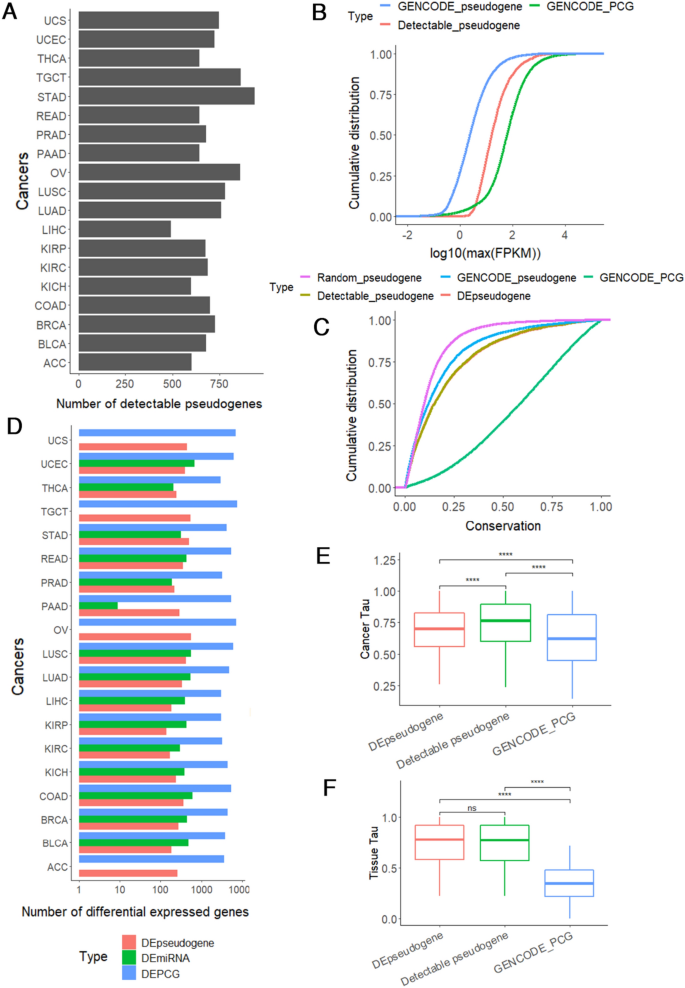
Overview of detectable pseudogenes in cancers and normal tissues. A The number of detectable pseudogenes (FPKM > 0.3) across cancer types. B Cumulative distribution curves of expression levels for all pseudogenes (GENCODE_pseudogene, blue color), detectable pseudogenes (orange color), and protein-coding genes (GENCODE_PCG, green color). C Cumulative distribution curves of conservation scores (PhastCons) for random pseudogenes, all pseudogenes (GENCODE_pseudogene), detectable pseudogenes, differentially expressed pseudogenes in cancer (DEpseudogene), and protein-coding genes (GENCODE_PCG). D Barplot showing numbers of differentially expressed pseudogenes (DEpseudogene), protein-coding genes (DEPCG), and miRNAs (DEmiRNA). E–F Boxplots showing cancer specificity index E or normal tissue specificity F for DEpseudogene, detectable pseudogenes, and GENCODE_PCG. Two-sided Wilcoxon test. ns P > 0.05; **** P < 0.0001
Most pseudogene ceRNA networks were cancer type-specific
High similarity between pseudogenes and their parental genes makes pseudogenes ideal sponges for miRNAs that targeting their parental genes, which is central to the ceRNA theory (Salmena et al., 2011). Some pseudogenes have already been identified as ceRNAs in public databases, including Starbase (Li et al., 2014) and Dreambase (Zheng et al., 2018). To further expand and explore the network of pseudogene ceRNAs with our large pseudogene set, we built pseudogene ceRNA networks in 14 cancer types (of the 19 cancers, four without miRNA sequencing data and one with only nine samples downloaded) (Table S3). Of the 808 pseudogene ceRNAs, 376 were annotated in either Starbase or Dreambase (Fig. 2A), including the well-known tumor suppressive pseudogene PTENP1 (Gao et al., 2017). To study cancer type differences of these ceRNA networks, we calculated pairwise Jaccard Distances (JD, larger values indicate more difference) among these networks, separately for PCGs (cePCGs, Fig. 2B), pseudogenes (cePseudogenes, Fig. 2C), and miRNAs (ceMiRNAs, Fig. 2D). As expected, cancer types from the same organ, such as COAD-READ (particularly for miRNA ceRNAs) and KIRC-KIRP, showed smaller JDs overall. Several cancer types had consistently similar JDs, such as STAD, COAD, READ, UCEC, BRCA, LUAD, and LUSC, suggesting similar ceRNA regulation in these cancers. Generally, cePseudogenes showed the largest JDs, while ceMiRNAs showed the smallest JDs. On the other hand, 10–30% cePCGs were cancer hallmarks (Fig. 2E), highlighting the significance of our pseudogene ceRNA networks.
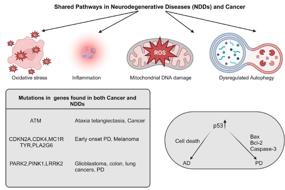
Fig. 2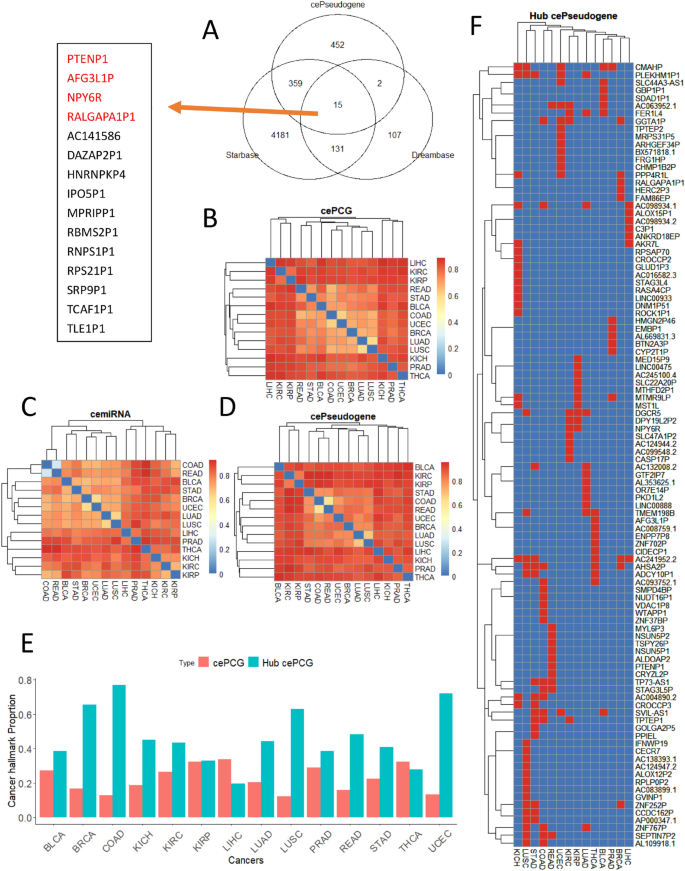
Characteristics of pseudogene ceRNA networks in cancer. A Comparison of 808 pseudogenes in 14 ceRNA networks in this study with previous ceRNA pseudogenes deposited in two public databases. Fifteen overlapping pseudogenes were shown in the box and four were highlighted. B–D Heatmaps of Jaccard distances (describing node differences between two networks; higher values indicate larger differences) between cancer pairs for B cemiRNAs, C cePseudogenes, and D cePCGs. E Barplot showing proportion of cePCGs from cancer hallmarks. F Heatmap showing hub genes (rows) in red color across 14 cancer types (columns)
We identified hub pseudogenes using six algorithms to further prioritize pseudogenes (see Methods). In total, there were 102 hub pseudogenes (Fig. 2F) in ceRNA networks and most (n = 70) of these hubs, such as PTENP1, were specific to one cancer type, indicating cancer type-specific pseudogene ceRNA regulation. Of note, two types of kidney cancers, KIRC and KIRP, shared three hubs, DGCR5, DPY19L2P2, and NPY6R. Similarly, two types of lung cancers (LUAD and LUSC) shared DGCR5, ZNF767P, and PLEKHM1P1, while colorectal cancers (COAD and READ) shared SEPTIN7P2, STAG3L5P, and TP73-AS1 (also in STAD). Interestingly, the following hubs were frequently shared by multiple cancers, including AC241952.2, AHSA2P, CMAHP, PLEKHM1P1, DGCR5, GGTA1P, and SVIL-AS1.
The ZNF252P/AL390726.5/miR-17/ESR1 subnetwork regulates breast cancer cells
Next, to investigate pseudogenes in detail, we focused on the pseudogene ceRNA network in BRCA, which included 161 cePseudogenes, 2711 cePCGs, and 123 ceMiRNAs. It is possible that functions of poorly annotated cePseudogenes could be reflected by cePCGs in the same network. As expected, we found that breast cancer-related gene sets were significantly enriched for BRCA cePCGs, based on DisGeNET (http://www.disgenet.org) (Fig. S1A). By using gene ontology analysis, we found that cePCGs were significantly enriched in vasculature development, cell growth, cell division, and cell adhesion, all of which are factors closely related to cancer (Fig. S1B).
To prioritize cePCGs, we identified hub cePCGs and ceMiRNAs of the BRCA ceRNA network by Cytohubba using 11 methods for hub metric calculation (see Methods). Based on the closeness method, the top ten hubs included three members of the miR-17 family and seven cePCGs, including ESR1, CA12, ABHD2, FAM102A, SLC7A2, PRLR, and RBM47 (Fig. 3A), which were consistent with other methods (Fig. S2). Among these hub cePCGs, ESR1 (estrogen receptor 1) competed with six pseudogene sponges (AC114495.2, GTF2IP7, ZNF252P, AL390726.5, CYP2T1P, AC010326.4) to interact with hub miRNAs, miR-106a-5p, miR-106b-5p, and miR-17-5p.
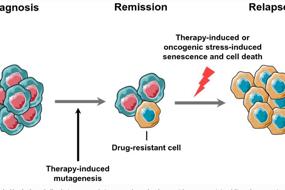
Fig. 3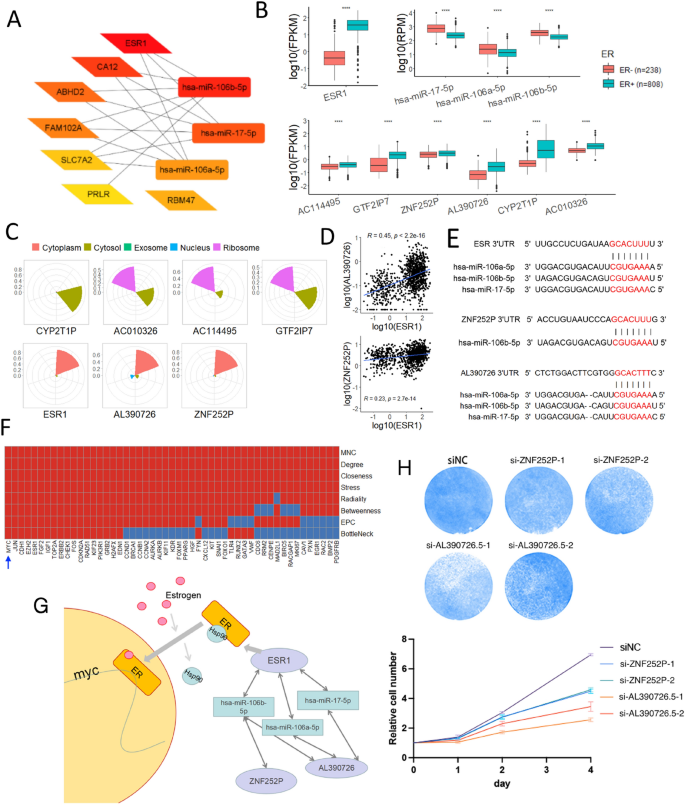
The pseudogene-estrogen receptor ceRNA subnetwork regulates MYC in breast cancer. A Subnetwork of the top 10 ceRNA nodes based on closeness in BRCA. Darker color indicates higher ranking. B Differential expression (two-sided t-test, ****P < 0.0001) of hub cePCG ESR1 (top left panel), hub cemiRNAs (top right panel), and cePseudogenes (bottom panel) that regulate ESR1 in the BRCA ceRNA network. Samples were grouped by ER + or ER− by IHC. C Predicted subcellular localizations of cePCG (ESR1) and cePseudogene (AC114495.2, GTF2IP7, ZNF252P, AL390726.5, CYP2T1P, and AC010326.4). D Expression correlation between ESR1 and cePseudogenes, AL390726.5 (top panel) and ZNF252P (bottom panel). E Binding sites of miRNAs in ESR1 and cePseudogenes were shown. miRNA seed sequences and their matched target sequences were highlighted. F MYC is identified by eight algorithms (rows) as one of the hub gene nodes (red color, columns) of the cePCG-derived PPI network. G Schematic diagram of relationship of MYC and the ZNF252P/AL390726.5-miRNA-ESR1 regulatory axis in BRCA. H Knocking down pseudogenes (ZNF252P or AL390726.5) significantly inhibited MDA-MB-231 breast cancer cells proliferation. One representative experiment for each siRNA were shown on the top
To support the ESR1 subnetwork of ceRNAs, we compared ER + and ER- BRCA samples as determined by immunohistochemistry (IHC). As expected, ESR1 RNA expression was much higher in ER + than in ER − samples, while miR-17 members were higher in ER- samples (Fig. 3B). Interestingly, similar to ESR1, all six cePseudogenes in this subnetwork showed higher expression in ER + samples. Therefore, both lower ceMiRNAs and higher cePseudogenes to sponge ceMiRNAs may contribute to higher expression of ESR1 in ER + samples.
To select the most possible cePseudogenes critical for ESR1 regulation, we conducted further analysis. First, we predicted subcellular localization of ESR1 and the six cePseudogenes by lncLocator. We found that both AL390726.5 and ZNF252P were probably retained in the nucleus, as with the nuclear factor ESR1 (Fig. 3C). Moreover, both cePseudogenes, especially AL390726.5, showed positive co-expression with ESR1 (Fig. 3D) and shared ceMiRNA binding sites with ESR1 (Fig. 3E).
We further examined the protein–protein interaction (PPI) network of cePCGs in the BRCA ceRNA network. This PPI network contained 18 hub cePCGs, most of which, including ESR1, were identified as hubs by at least six methods of Cytohubba (Fig. 3F). Of note, 11 out of 18 hub cePCGs were cancer hallmark genes, including ESR1, CDKN2A, ERBB2, RAD51, and MYC.
We hypothesized that MYC was regulated by the ESR1 ceRNA subnetwork, where AL390726.5 and ZNF252P competitively bound to miR-17 to prevent ESR1 degradation (Fig. 3G). Increased cePseudogenes resulted in lower ESR1 degradation, hence higher ESR1 levels, to enhance the expression of estrogen-responsive MYC. Therefore, reducing cePseudogenes can probably reduce ESR1 expression and subsequently MYC expression. We tested our hypothesis by knocking down AL390726.5 or ZNF252P in MDA-MB-231 breast cancer cells, and we observed significant decrease of cell proliferation (Fig. 3H), supporting our hypothesis.
Immunoglobulin-enriched DEpseudogenes were featured in a malignant cancer subtype
Various omics features have been used to identify cancer subtypes. We attempted to use our DEpseudogenes to perform subtyping analysis in BRCA by using non-negative matrix factorization (NMF), a widely used algorithm to cluster samples (Gaujoux & Seoighe, 2010). BRCA samples were divided into three clusters, Cluster1, Cluster2, and Cluster3, each with 13, 15, and 21 DEpseudogenes respectively (Fig. 4A, Fig. S3). We found that Cluster3 showed high degree of similarity to malignant breast tumors, indicated by both the PAM50 and triple-negative breast cancer (TNBC) classification. Interestingly, 19 out 21 of Cluster3 DEpseudogenes were immunoglobulin pseudogenes (Table S4), suggesting an immune-infiltrated microenvironment. Indeed, we observed the highest immune cell infiltration in Cluster3, including B cells, CD4 + T cells, CD8 + T cells, neutrophils, and dendritic cells (Fig. 4B), most likely caused by those “nonfunctional” DEpseudogenes.
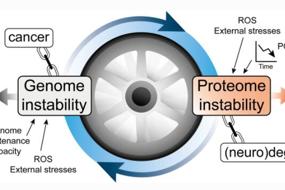
Fig. 4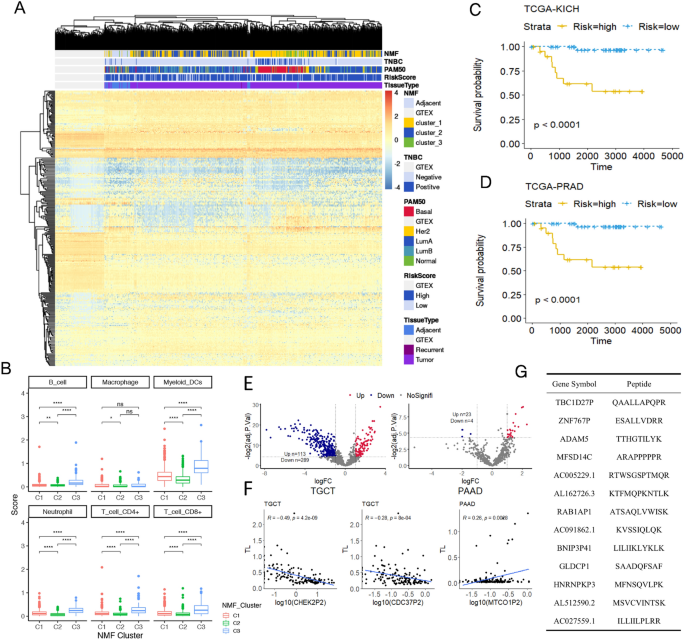
Pseudogenes were associated with various types of cancer features. A Comparison between reported breast cancer (BRCA) subtypes and the three subtypes based on pseudogene expression in this study. GTEx normal samples and BRCA adjacent noncancerous samples were included as negative controls. NMF non-negative matrix factorization; TNBC triple-negative breast cancer; PAM50, BRCA subtyping system; RiskScore, risk scores from survival-based model. B Immune infiltration scores (y-axis) of the three NMF subtypes (x-axis). ****P < 0.0001, ***P < 0.001, **P < 0.01, *P < 0.05, ns indicates P > 0.05. C–D Kaplan–Meier survival plots stratified by risk scores of patients from kidney cancer (KICH) (C) or prostate cancer (PRAD) D. E Volcano plots of regression analysis between pseudogene expression and telomere length (TL) in testis cancer (TGCT, left panel) and in pancreatic cancer (PAAD, right panel). Significantly negative or positive correlations were labeled as up or down, respectively. F Examples of significant correlation between TL and two pseudogenes (CHEK2P2 and CDC37P2) from TGCT or one from PAAD (MTCO1P2) shown in E. G Thirteen potential tumor neoantigens from pseudogene-derived peptides
To determine whether DEpseudogenes were prognostic for certain cancer types, we further performed survival analysis based on DEpseudogenes for each cancer (see Methods). We found that the risk models (Fig. S4A-B) in PRAD (Fig. 4C) and KICH (Fig. 4D) performed well (Fig. S4C-D) for patient prognosis.
Pseudogenes are potential factors affecting telomere length
Abnormal telomere regulation is a hallmark of cancer (Barthel et al., 2017). Pseudogenes may affect telomere length (TL) to promote cancer development. We examined this hypothesis and found 402 and 27 pseudogenes associated with TL in TGCT and PAAD, respectively (Fig. 4E). For example, CHEK2P2 and CDC37P2 were negatively correlated with TL in TGCT, whereas MTCO1P2 was positively correlated with TL in PAAD (Fig. 4F). CHEK2, the parental gene of CHEK2P2, is known to regulate TL (Oh et al., 2003). CDC37, the parental gene of CDC37P2, is a co-factor of the kinase chaperon Hsp90, which is in turn a co-factor of ATM and ATR that regulate TL, and CDC37 can promote ATM-ATR-Hsp90 interaction (Sugimoto, 2018). Therefore, the negative correlation between TL and CHEK2P2 and CDC37P2 suggests that both pseudogenes may interfere with their parental genes’ normal function of telomere regulation. Interestingly, MTCO1, the parental gene of MTCO1P2, appears to be a new TL regulator.
Pseudogenes contributed to cancer neoantigens
Although pseudogenes probably cannot produce stable functional proteins as their parental genes, recent research suggests that pseudogenes may generate short functional peptides that may be targeted specifically by drugs. We searched potential pseudogene peptides in mass spectrometry-based proteomics data to survey the pan-cancer landscape of pseudogene-derived neoantigens (PDNAs). After strict filtering (see Methods), we obtained 13 PDNAs found only in tumor and in at least two tumor samples (Fig. 4G). Pseudogenes with PDNAs included HNRNPKP3, ADAM5, and MFSD14C.
cePseudo: a comprehensive ceRNA database of pseudogenes
Finally, to facilitate the pseudogene research community, we constructed the cePseudo database (Fig. 5, http://bioinfo-sysu.com/cePseudo2), which includes the datasets and processed results from this study. Currently, users can query and download pseudogene expression level across cancer types from TCGA or normal tissues from GTEx. Users can also download Cytoscape (Shannon et al. 2003) (https://cytoscape.org) format data of full pseudogene ceRNA networks across cancer types for further investigation.
Fig. 5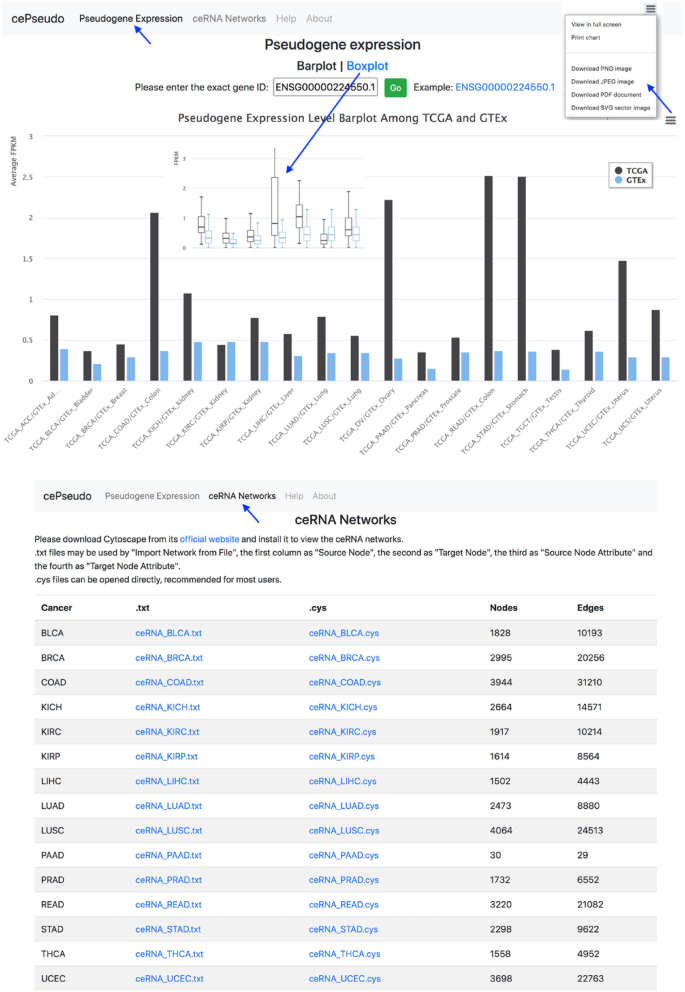
Overview of the cePseudo2 database. A An example of pseudogene expression across cancer types. Results can be displayed in either barplots or boxplots and downloaded as figures. B Downloadable resources of ceRNA networks constructed by this study
Discussion
In this work, we built a large confident set of pseudogenes and profiled their expression levels across cancers and normal tissues. We created an overall pseudogene–miRNA–mRNA ceRNA network in each cancer and comprehensively depicted features of these ceRNA networks. Specifically, we analyzed the BRCA ceRNA network in detail and uncovered a small ceRNA subnetwork including two pseudogenes (ZNF252P and AL390726.5) and ESR1, which regulated MYC to affect cell proliferation. This is the first systematic pan-cancer study of pseudogene-centered ceRNA networks and warrant further research.
Our pseudogene analysis results can be further used to explore ceRNAs of other oncogenes or tumor suppressors. For example, in addition to the miR-17/ESR1/MYC axis identified in the ceRNA network, we built another two ceRNA subnetworks for BRCA1/2 and PGR (progesterone receptor, or PR), respectively. Interestingly, a large number of pseudogenes were involved in the BRCA1/2 ceRNA subnetwork (Fig. S5). Similar to the miR-17/ESR1 subnetwork, two pseudogenes (HTR7P1 and RALGAPA1P1) and miR-181b-5p were involved in the PGR subnetwork (Fig. S6). Both HTR7P1 and RALGAPA1P1 were differentially expressed between samples PR + and PR− samples (Fig. S6A-C). Both pseudogenes were positively correlated with PGR expression (Fig. S6D) and competed for miR-181b-5p binding sites with PGR (Fig. S6E).
PCGs dominated the ceRNA networks across cancers. Interestingly, most hubs of PCGs or pseudogenes were cancer type-specific; however, they converged to several cancer hallmarks across cancer types, suggesting that different cancers may disrupt different molecules, including regulatory pseudogenes, of the same cancer-causing pathways. Similar phenomena have been observed in ceRNA networks of various drug resistance (Liu et al., 2021) and in general lncRNA networks in cancer (Zhang et al., 2016).
Collectively, our study uncovered important functions and potential mechanisms of pseudogenes in cancer and provided resources for further research into pseudogenes. Our future work would consist of two directions, in-depth analysis of more cancers other than BRCA, and further experimental validation of molecular mechanisms of important ceRNA subnetworks and neoantigens.
Methods
Annotation of confident pseudogenes
Two annotation files containing pseudogenes were downloaded from GENCODE website (https://www.gencodegenes.org/human), gencode.v34.annotation.gff3 (containing 15,265 pseudogenes) and gencode.v34.2wayconspseudo.gff3 (containing 9,020 pseudogenes). Only 377 pseudogenes from the second file had no overlap with the first file and were merged into the initial set of pseudogenes. Similar to previous studies (Han et al., 2014), we obtained confident pseudogene exons by filtering the initial pseudogenes as follows: (1) remove exons overlapping exons of protein-coding genes; (2) remove exons with genome-wide alignable score < 0.95 as calculated by GenMap (Pockrandt et al., 2020). Finally, a total of 9,455 pseudogenes (23,832 exons) remained for downstream analysis.
Sequencing data processing and pseudogene quantification
SRA files of GTEx were converted to FASTQ format using fastq-dump and quality-controlled by Trimmomatic (Bolger et al., 2014). To be consistent with TCGA RNA-seq BAM file generation, GTEx FASTQ files were aligned to the hg38 reference by STAR (Dobin et al., 2013) using the 2-pass mode to obtain BAM files. Duplicated reads in BAM files were removed by using samtools (https://github.com/samtools/samtools) before pseudogene quantification by featureCounts (Liao et al., 2014) in raw read counts. FPKMs were calculated from raw read counts and only detectable pseudogenes (average FPKM > 0.3) (Han et al., 2014) were kept for each cancer type.
Differential expression analysis
We identified differentially expressed protein-coding genes, pseudogenes, and miRNAs by using R package edgeR (Robinson et al., 2010). Read counts of protein-coding genes of TCGA or GTEx were obtained from GDC (https://portal.gdc.cancer.gov) or UCSC Xena (Goldman et al., 2020), respectively. TCGA quantification of miRNA isoforms were used. Significance was set by Log2FC > 1 and FDR < 0.05.
Analysis of sequence conservation and tissue specificity of pseudogenes
Vertebrate PhastCons scores (100way) were downloaded from the UCSC Genome Browser (http://genome.ucsc.edu). Average PhastCons scores of exons for each pseudogene was defined as the pseudogene sequence conservation. For tissue specificity, we calculated the Tau index τ (Kryuchkova-Mostacci & Robinson-Rechavi, 2017) as follows:
τ=∑nl=1(1−xlˆ)n−1;xlˆ=xlmax1≤l≤n(xl)where xl is the gene expression in tissue l, and n is the number of tissues.
Construction and analysis of ceRNA networks
We downloaded miRNA binding sites on mRNAs from Dreambase (Zheng et al., 2018). MiRNA binding sites on pseudogenes were predicted by TargetScan (Agarwal et al., 2015) or miRanda (Betel et al. 2010) using miRbase v21 (https://www.mirbase.org, consistent with TCGA miRNA quantification reference). Then, the ceRNA network in each cancer was constructed as follows: (1) extract miRNA-pseudogene and miRNA-mRNA pairs for differentially expressed miRNAs. (2) keep both types of pairs with Pearson correlation R < 0. (3) for pseudogenes and mRNAs potentially competing for the same miRNA, keep mRNA-pseudogene pairs with Pearson correlation R > 0.1 and FDR < 0.05, and further keep mRNA-pseudogene pairs with a relative expression ratio ranging from 0.01 to 100. (4) remove miRNAs if both their target mRNAs and pseudogenes have been removed.
After construction of ceRNA networks, we calculated frequencies of pseudogenes, PCGs, and miRNAs across cancers. Jaccard distances between pairwise ceRNA networks of cancers were calculated by the R package vegan (https://github.com/vegandevs/vegan) and visualized by the R package pheatmap (https://cran.r-project.org/package=pheatmap). We used Metascape (Zhou et al., 2019) to conduct functional enrichment of PCGs connected with pseudogenes in ceRNA networks. Two categories of enrichment were extracted, gene ontologies and DisGeNET diseases (Pinero et al., 2017). Hub genes of ceRNA networks were identified by Cytohubba (Chin et al., 2014), which provides 11 methods for network statistics, including degree, edge percolated component (EPC), maximum neighborhood component, density of maximum neighborhood component, maximal clique centrality, and six types of centeredness (bottleneck, eccentricity, closeness, radiality, betweenness, and stress). Nodes were considered hubs if prioritized to be top 10% by at least three methods among degree, EPC, closeness, radiality, betweenness, and stress.
Definition of cancer hallmark genes
GO terms associated with these cancer hallmarks were obtained from (Plaisier et al., 2012). These hallmarks included tissue invasion and metastasis, evading apoptosis, self-sufficiency in growth signals, insensitivity to antigrowth signals, limitless replicative potential, reprogramming energy metabolism, sustained angiogenesis, evading immune detection, genome instability and mutation, and tumor promoting inflammation. Genes corresponding to these GO terms were extracted by querying the gene2go annotations downloaded from NCBI (ftp://ftp.ncbi.nih.gov/gene/DATA).
Subcellular location analysis
Subcellular locations (cytoplasm, nucleus, ribosome, cytosol, or exosome) of protein-coding genes or potential protein products of pseudogenes were predicted by LncLocator (https://www.csbio.sjtu.edu.cn/bioinf/lncLocator) (Cao et al., 2018), which only need input of gene DNA sequences.
PPI analysis of ceRNA network nodes
First, ceRNA network nodes with degree < 3 were removed. Then, we extracted PPIs of BRCA cePCGs from the STRING database (Szklarczyk et al., 2019) and visualized them in Cytoscape (Shannon et al., 2003). A total of 1,919 genes with 17,577 interactions were obtained. Cytohubba (Chin et al., 2014) was used for hub gene analysis. The top 5% of hub genes identified by each hub algorithm were merged and only those identified by at least six algorithms were kept as final hub genes.
Association between telomere length and pseudogene expression
Pan-cancer telomere lengths (TL) were obtained from (Barthel et al., 2017). We examined associations between TL and pseudogene expression by using linear regression models from the limma R package (Ritchie et al., 2015), adjusted for age.
Calculating pseudogene-based risk score for patients
We only used differentially expressed pseudogenes for risk calculation. First, we conducted single-pseudogene Cox regression (R packages survival [https://cran.r-project.org/web/packages/survival/index.html] and survminer [https://cran.r-project.org/web/packages/survminer/readme/README.html]) for DEpseudogenes to select pseudogenes associated with patient survival with nominal significance (P < 0.05). Then, the least absolute shrinkage and selection operator (LASSO) from R package glmnet (https://cran.r-project.org/web/packages/glmnet/index.html) was used to select multiple non-redundant pseudogenes. Lastly, we calculated the risk score for each patient with pseudogene expression and LASSO-determined pseudogene coefficients:
RiskScore=∑i=1nwixiwhere n is the total number of LASSO selected pseudogenes, Wi were the LASSO coefficients of pseudogenes, and Xi were pseudogene expression levels.
NMF-based subtyping analysis
The expression matrix of differentially expressed pseudogenes between tumor and adjacent noncancerous tissues were used as input of the R package NMF (Gaujoux & Seoighe, 2010). A total of 50 rounds of NMF computations with different values of parameter r (2, 3, 4, 5, or 6) were performed. The r value corresponding to the elbow point of cophenetic coefficient was chosen for final NMF computation, with the parameter nrun = 200.
Mass spectrometry-based proteomics analysis
DNA sequences of pseudogenes were extracted by bedtools (Quinlan & Hall, 2010) using the curated GTF file of pseudogenes and translated into peptides using all six frames. Comet (Eng et al., 2013) was used to search for proteomic support of pseudogene peptides. Percolator (The et al., 2016) was used for quality control (q < 0.01 and minimum 8-12aa) for Comet output. Comet results overlapping UniProt (https://www.uniprot.org) peptides of protein-coding genes (UP00005640) were removed. Next, netMHC (Nielsen et al., 2007) was used to filter out peptides with low binding affinity of MHC molecules. Finally, only peptides detected in at least two tumor samples were kept as putative neoantigens.
Other bioinformatics analysis
For tumor immune infiltration, immune cell fractions were downloaded from TIMER2.0 (http://timer.cistrome.org) and were compared between subtypes by two-sided Wilcoxon test. We created the cePseudo website by using the LAMP (Linux, Apache, MySQL, PHP) framework.
Colony formation assays
MDA-MB-231 cells after siRNA treatment were cultured in 6-wells plates at a density of 800 cells/well and allowed to grow untouched for 8 days at 5% CO2, 37 °C. Thereafter, the cells were washed with phosphate-buffered saline (PBS) and fixated with 4% paraformaldehyde for 15 min before Giemsa staining for 10 min. Thereafter, the number of clones was counted and the rate of colony formation was calculated.
Cell proliferation assay
Cells were cultured in four 96-well plates at a concentration of 2000 cells/100 μL per well and evaluated daily for 4 d. Every day, we chose one of the five plates and calculate the cell number by Hemocytometer, and the remaining plates were cultured in a 5% CO2 incubator at 37 °C.
Cell transfection with plasmids or siRNAs
Cells were cultured in 6-wells plates at a 50% confluence, and then siRNA were added followed the standard protocol. After 2 days, these cells will be carried by indicated assay. Sequences of siRNA were included in Table S5.
Data availability
GTEx RNA-seq sequencing reads files were downloaded from dbGaP (phs000424.v8.p2). TCGA RNA-seq BAM files were downloaded from GDC (https://portal.gdc.cancer.gov). Expression levels of PCGs (HTSeq-FPKM and HTSeq-Counts) and miRNAs (mirbase21.isoforms.quantification.txt) and clinical information were downloaded from the UCSC Xena database (https://xenabrowser.net). CPTAC proteomics data were available at https://proteomics.cancer.gov/programs/cptac.
References
Agarwal, V., Bell, G. W., Nam, J. W., & Bartel, D. P. (2015). Predicting effective microRNA target sites in mammalian mRNAs. eLife, 4, e05005.
Aguda, B. D., Kim, Y., Piper-Hunter, M. G., Friedman, A., & Marsh, C. B. (2008). MicroRNA regulation of a cancer network: consequences of the feedback loops involving miR-17-92, E2F, and Myc. Proceedings of the National Academy of Sciences, 105, 19678–19683.
Balakirev, E. S., & Ayala, F. J. (2003). Pseudogenes: Are they “junk” or functional DNA? Annual Review of Genetics, 37, 123–151.
Barthel, F. P., Wei, W., Tang, M., Martinez-Ledesma, E., Hu, X., Amin, S. B., Akdemir, K. C., Seth, S., Song, X., Wang, Q., et al. (2017). Systematic analysis of telomere length and somatic alterations in 31 cancer types. Nature Genetics, 49, 349–357.
Betel, D., Koppal, A., Agius, P., Sander, C., & Leslie, C. (2010). Comprehensive modeling of microRNA targets predicts functional non-conserved and non-canonical sites. Genome Biology, 11, R90.
Bolger, A. M., Lohse, M., & Usadel, B. (2014). Trimmomatic: a flexible trimmer for Illumina sequence data. Bioinformatics, 30, 2114–2120.
Brosch, M., Saunders, G. I., Frankish, A., Collins, M. O., Yu, L., Wright, J., Verstraten, R., Adams, D. J., Harrow, J., Choudhary, J. S., et al. (2011). Shotgun proteomics aids discovery of novel protein-coding genes, alternative splicing, and “resurrected” pseudogenes in the mouse genome. Genome Research, 21, 756–767.
Cao, Z., Pan, X., Yang, Y., Huang, Y., & Shen, H. B. (2018). The lnclocator: a subcellular localization predictor for long non-coding RNAs based on a stacked ensemble classifier. Bioinformatics, 34, 2185–2194.
Cheetham, S. W., Faulkner, G. J., & Dinger, M. E. (2020). Overcoming challenges and dogmas to understand the functions of pseudogenes. Nature Reviews Genetics, 21, 191–201.
Chin, C. H., Chen, S. H., Wu, H. H., Ho, C. W., Ko, M. T., & Lin, C. Y. (2014). cytoHubba: identifying hub objects and sub-networks from complex interactome. BMC Systems Biology, 8(Suppl 4), S11.
Deming, S. L., Nass, S. J., Dickson, R. B., & Trock, B. J. (2000). C-myc amplification in breast cancer: a meta-analysis of its occurrence and prognostic relevance. British Journal of Cancer, 83, 1688–1695.
Dhawan, A., Scott, J. G., Harris, A. L., & Buffa, F. M. (2018). Pan-cancer characterisation of microRNA across cancer hallmarks reveals microRNA-mediated downregulation of tumour suppressors. Nature Communications, 9, 5228.
Dobin, A., Davis, C. A., Schlesinger, F., Drenkow, J., Zaleski, C., Jha, S., Batut, P., Chaisson, M., & Gingeras, T. R. (2013). STAR: ultrafast universal RNA-seq aligner. Bioinformatics, 29, 15–21.
Eng, J. K., Jahan, T. A., & Hoopmann, M. R. (2013). Comet: An open-source MS/MS sequence database search tool. Proteomics, 13, 22–24.
Fan, M., Sethuraman, A., Brown, M., Sun, W., & Pfeffer, L. M. (2014). Systematic analysis of metastasis-associated genes identifies miR-17-5p as a metastatic suppressor of basal-like breast cancer. Breast Cancer Research and Treatment, 146, 487–502.
Gao, L., Ren, W., Zhang, L., Li, S., Kong, X., Zhang, H., Dong, J., Cai, G., Jin, C., Zheng, D., et al. (2017). PTENp1, a natural sponge of miR-21, mediates PTEN expression to inhibit the proliferation of oral squamous cell carcinoma. Molecular Carcinogenesis, 56, 1322–1334.
Gaujoux, R., & Seoighe, C. (2010). A flexible R package for nonnegative matrix factorization. BMC Bioinformatics, 11, 367.
Goldman, M. J., Craft, B., Hastie, M., Repecka, K., McDade, F., Kamath, A., Banerjee, A., Luo, Y., Rogers, D., Brooks, A. N., et al. (2020). Visualizing and interpreting cancer genomics data via the Xena platform. Nature Biotechnology, 38, 675–678.
Han, L., Yuan, Y., Zheng, S., Yang, Y., Li, J., Edgerton, M. E., Diao, L., Xu, Y., Verhaak, R. G. W., & Liang, H. (2014). The pan-cancer analysis of pseudogene expression reveals biologically and clinically relevant tumour subtypes. Nature Communications, 5, 3963.
Hanahan, D. (2022). Hallmarks of Cancer: New Dimensions. Cancer Discovery, 12, 31–46.
Hayashi, H., Arao, T., Togashi, Y., Kato, H., Fujita, Y., De Velasco, M. A., Kimura, H., Matsumoto, K., Tanaka, K., Okamoto, I., et al. (2015). The OCT4 pseudogene POU5F1B is amplified and promotes an aggressive phenotype in gastric cancer. Oncogene, 34, 199–208.
Ji, Z., Song, R., Regev, A., & Struhl, K. (2015). Many lncRNAs, 5’UTRs, and pseudogenes are translated and some are likely to express functional proteins. eLife, 4, e08890.
Kalyana-Sundaram, S., Kumar-Sinha, C., Shankar, S., Robinson, D. R., Wu, Y. M., Cao, X., Asangani, I. A., Kothari, V., Prensner, J. R., Lonigro, R. J., et al. (2012). Expressed pseudogenes in the transcriptional landscape of human cancers. Cell, 149, 1622–1634.
Karreth, F. A., Reschke, M., Ruocco, A., Ng, C., Chapuy, B., Leopold, V., Sjoberg, M., Keane, T. M., Verma, A., Ala, U., et al. (2015). The BRAF pseudogene functions as a competitive endogenous RNA and induces lymphoma in vivo. Cell, 161, 319–332.
Kryuchkova-Mostacci, N., & Robinson-Rechavi, M. (2017). A benchmark of gene expression tissue-specificity metrics. Briefings in Bioinformatics, 18, 205–214.
Li, J. H., Liu, S., Zhou, H., Qu, L. H., & Yang, J. H. (2014). starBase v2.0: Decoding miRNA-ceRNA, miRNA-ncRNA and protein-RNA interaction networks from large-scale CLIP-Seq data. Nucleic Acids Research, 42, D92-97.
Liao, Y., Smyth, G. K., & Shi, W. (2014). featureCounts: an efficient general purpose program for assigning sequence reads to genomic features. Bioinformatics, 30, 923–930.
Liu, B., Zhou, X., Wu, D., Zhang, X., Shen, X., Mi, K., Qu, Z., Jiang, Y., & Shang, D. (2021). Comprehensive characterization of a drug-resistance-related ceRNA network across 15 anti-cancer drug categories. Mol Ther Nucleic Acids, 24, 11–24.
Nielsen, M., Lundegaard, C., Blicher, T., Lamberth, K., Harndahl, M., Justesen, S., Roder, G., Peters, B., Sette, A., Lund, O., et al. (2007). NetMHCpan, a method for quantitative predictions of peptide binding to any HLA-A and -B locus protein of known sequence. PLoS ONE, 2, e796.
Oh, H., Wang, S. C., Prahash, A., Sano, M., Moravec, C. S., Taffet, G. E., Michael, L. H., Youker, K. A., Entman, M. L., & Schneider, M. D. (2003). Telomere attrition and Chk2 activation in human heart failure. Proceedings of the National Academy of Sciences, 100, 5378–5383.
Pinero, J., Bravo, A., Queralt-Rosinach, N., Gutierrez-Sacristan, A., Deu-Pons, J., Centeno, E., Garcia-Garcia, J., Sanz, F., & Furlong, L. I. (2017). DisGeNET: a comprehensive platform integrating information on human disease-associated genes and variants. Nucleic Acids Research, 45, D833–D839.
Pink, R. C., Wicks, K., Caley, D. P., Punch, E. K., Jacobs, L., & Carter, D. R. (2011). Pseudogenes: pseudo-functional or key regulators in health and disease? RNA, 17, 792–798.
Plaisier, C. L., Pan, M., & Baliga, N. S. (2012). A miRNA-regulatory network explains how dysregulated miRNAs perturb oncogenic processes across diverse cancers. Genome Research, 22, 2302–2314.
Pockrandt, C., Alzamel, M., Iliopoulos, C. S., & Reinert, K. (2020). GenMap: ultra-fast computation of genome mappability. Bioinformatics, 36, 3687–3692.
Poliseno, L., Salmena, L., Zhang, J., Carver, B., Haveman, W. J., & Pandolfi, P. P. (2010). A coding-independent function of gene and pseudogene mRNAs regulates tumour biology. Nature, 465, 1033–1038.
Poursani, E. M., Mohammad Soltani, B., & Mowla, S. J. (2016). Differential expression of OCT4 pseudogenes in pluripotent and tumor cell lines. Cell Journal, 18, 28–36.
Quinlan, A. R., & Hall, I. M. (2010). BEDTools: a flexible suite of utilities for comparing genomic features. Bioinformatics, 26, 841–842.
Ritchie, M. E., Phipson, B., Wu, D., Hu, Y., Law, C. W., Shi, W., & Smyth, G. K. (2015). limma powers differential expression analyses for RNA-sequencing and microarray studies. Nucleic Acids Research, 43, e47.
Robinson, D. R., Wu, Y. M., Vats, P., Su, F., Lonigro, R. J., Cao, X., Kalyana-Sundaram, S., Wang, R., Ning, Y., Hodges, L., et al. (2013). Activating ESR1 mutations in hormone-resistant metastatic breast cancer. Nature Genetics, 45, 1446–1451.
Robinson, M. D., McCarthy, D. J., & Smyth, G. K. (2010). edgeR: a bioconductor package for differential expression analysis of digital gene expression data. Bioinformatics, 26, 139–140.
Salmena, L., Poliseno, L., Tay, Y., Kats, L., & Pandolfi, P. P. (2011). A ceRNA hypothesis: the Rosetta stone of a hidden RNA language? Cell, 146, 353–358.
Shannon, P., Markiel, A., Ozier, O., Baliga, N. S., Wang, J. T., Ramage, D., Amin, N., Schwikowski, B., & Ideker, T. (2003). Cytoscape: a software environment for integrated models of biomolecular interaction networks. Genome Research, 13, 2498–2504.
Sugimoto, K. (2018). Branching the Tel2 pathway for exact fit on phosphatidylinositol 3-kinase-related kinases. Current Genetics, 64, 965–970.
Sung, H., Ferlay, J., Siegel, R. L., Laversanne, M., Soerjomataram, I., Jemal, A., & Bray, F. (2021). Global cancer statistics 2020: GLOBOCAN estimates of incidence and mortality worldwide for 36 cancers in 185 countries. CA: A Cancer Journal for Clinicians, 71, 209–249.
Szklarczyk, D., Gable, A. L., Lyon, D., Junge, A., Wyder, S., Huerta-Cepas, J., Simonovic, M., Doncheva, N. T., Morris, J. H., Bork, P., et al. (2019). STRING v11: protein-protein association networks with increased coverage, supporting functional discovery in genome-wide experimental datasets. Nucleic Acids Research, 47, D607–D613.
The, M., MacCoss, M. J., Noble, W. S., & Kall, L. (2016). Fast and Accurate protein false discovery rates on large-scale proteomics data sets with percolator 3.0. Journal of the American Society for Mass Spectrometry, 27, 1719–1727.
Tian, X., Song, J., Zhang, X., Yan, M., Wang, S., Wang, Y., Xu, L., Zhao, L., Wei, J. J., Shao, C., et al. (2020). MYC-regulated pseudogene HMGA1P6 promotes ovarian cancer malignancy via augmenting the oncogenic HMGA1/2. Cell Death & Disease, 11, 167.
Wang, C., Mayer, J. A., Mazumdar, A., Fertuck, K., Kim, H., Brown, M., & Brown, P. H. (2011). Estrogen induces c-myc gene expression via an upstream enhancer activated by the estrogen receptor and the AP-1 transcription factor. Molecular Endocrinology, 25, 1527–1538.
Zhang, Y., Xu, Y., Feng, L., Li, F., Sun, Z., Wu, T., Shi, X., Li, J., & Li, X. (2016). Comprehensive characterization of lncRNA-mRNA related ceRNA network across 12 major cancers. Oncotarget, 7, 64148–64167.
Zheng, L. L., Zhou, K. R., Liu, S., Zhang, D. Y., Wang, Z. L., Chen, Z. R., Yang, J. H., & Qu, L. H. (2018). dreamBase: DNA modification, RNA regulation and protein binding of expressed pseudogenes in human health and disease. Nucleic Acids Research, 46, D85–D91.
Zhou, Y., Zhou, B., Pache, L., Chang, M., Khodabakhshi, A. H., Tanaseichuk, O., Benner, C., & Chanda, S. K. (2019). Metascape provides a biologist-oriented resource for the analysis of systems-level datasets. Nature Communications, 10, 1523.
Acknowledgements
The research has been supported by the Integrated Project of Major Research Plan of National Natural Science Foundation of China (NSFC) (92249303) and Guangdong Basic and Applied Basic Research Foundation (2021A1515110972). The results shown here are in whole or in part based upon data generated by the TCGA or CPTAC Research Network.
Funding
Integrated Project of Major Research Plan of National Natural Science Foundation of China, 92249303, Yuanyan Xiong; Basic and Applied Basic Research Foundation of Guangdong Province, 2021A1515110972, Mengbiao Guo.
Author information
Mengbiao Guo, Jingkai Zhang, Qiaoling Liang and Jianxi Zhu have contributed equally.
Authors and Affiliations
Institute of Healthy Aging Research, School of Life Sciences, Key Laboratory of Gene Engineering of the Ministry of Education, Sun Yat-sen University, Guangzhou, 510006, China
Mengbiao Guo, Jingkai Zhang, Qiaoling Liang, Jianxi Zhu, Zhengwen Fang, Zhou Songyang & Yuanyan Xiong
Clinical Research Center, The Seventh Affiliated Hospital, Sun Yat-sen University, Shenzhen, 518107, China
Qi Wang
Contributions
YYX and MBG conceived the project. QLL, MBG, and JKZ analyzed the data and interpreted the results. JXZ, QW, MHX, and ZWF performed experimental validation. MBG wrote the manuscript. MBG and JKZ revised the manuscript. YYX, MBG, QW, and ZSY reviewed the manuscript. All authors approved the final manuscript.
Corresponding authors
Correspondence to Zhou Songyang or Yuanyan Xiong.
Ethics declarations
Conflict of interest
The authors declare that they have no conflict of interest.
Supplementary Information
Below is the link to the electronic supplementary material.
Supplementary file1 (XLSX 16 KB)
Supplementary file1 (docx 2896 KB)
Rights and permissions
Springer Nature or its licensor (e.g. a society or other partner) holds exclusive rights to this article under a publishing agreement with the author(s) or other rightsholder(s); author self-archiving of the accepted manuscript version of this article is solely governed by the terms of such publishing agreement and applicable law.
About this article
Cite this article
Guo, M., Zhang, J., Liang, Q. et al. Pan-cancer pseudogene RNA analysis reveals a regulatory network promoting cancer cell proliferation. GENOME INSTAB. DIS. 4, 85–97 (2023). https://doi.org/10.1007/s42764-023-00097-2
Received16 December 2022
Revised07 January 2023
Accepted28 January 2023
Published10 February 2023
Issue DateApril 2023
DOIhttps://doi.org/10.1007/s42764-023-00097-2
Share this article
Anyone you share the following link with will be able to read this content:
Get shareable linkKeywords
Pan-cancer
Pseudogene lncRNA
ceRNA network
Subtype
用户登录
还没有账号?
立即注册