Identification of a novel inflammation-related gene signature for predicting inflammatory breast cancer survival
Original Research Paper
Weiyu Bai, Qinggang Hao, Zhimeng Zhang, Bingxing Han, Huilin Xiao, Dong Chang, Yun Zhu, Junling Shen & Jianwei Sun
Genome Instability & Disease 4, 154–175 (2023)
Abstract
Breast cancer is the most common cancer type and ranks the second in cancer-related deaths in women. However, the relationship between inflammation-related gene signatures and the prognosis of breast cancer remains elusive. Here, we show that breast invasive carcinoma (BRCA) can be classified into high-risk and low-risk groups based on the level of inflammation. These groups have different tumor immune microenvironments, prognoses, and drug sensitivities. In general, breast cancer patients in high-risk groups have higher macrophage abundance, higher tumor mutation burden (TMB), and the signaling pathways related to the inflammatory response and immune response are activated. Our study demonstrates that the high-risk group of breast cancer patients exhibit a high prevalence of M2 macrophages, as well as a high incidence of tumor mutations in conjunction with an inflammatory response. Furthermore, our analysis indicates that PD.0332991 and ROSCOVITINE exhibit greater efficacy in the treatment of low-risk inflammatory breast cancer, while Bicalutamide and Imatinib demonstrate greater efficacy in the treatment of high-risk patients. In sum, our model exhibited numerous advantages. It not only overcame the challenge posed by the heterogeneity of cancer to clinical diagnosis, but also accurately predicted the prognosis of subtypes of breast cancer patients. This provides valuable reference for clinical practitioners and assists patients in obtaining the best chemotherapy regimen.
Background
Inflammation involves the activation, recruitment, and action of cells of innate and adaptive immunity (Greten & Grivennikov, 2019). The presence of cytokines and inflammatory cells in the tumor microenvironment plays a crucial role in determining the outcome of the host anti-tumor response (Akbay et al., 2017). Uncontrolled inflammatory response leads to autoinflammatory diseases, neurodegenerative diseases, and cancer (e.g. inflammatory bowel disease—colorectal cancer; chronic esophagitis-esophageal cancer; and primary biliary cirrhosis—hepatocellular carcinoma) (Dinarello, 2010; Mighri et al., 2022; Ruan et al., 2022). A number of inflammatory diseases have been linked to cancers, for instance, inflammatory bowel disease to colorectal cancer; chronic esophagitis to esophageal cancer; and primary biliary cirrhosis to hepatocellular carcinoma (Paparodis et al., 2014). The inflammation process, which promotes cancer growth, and dissemination and activate oncogenic signaling pathways, has been proposed as a mechanism of immunoresistance in cancer patients with (Mezquita et al., 2018). Tumor-associated inflammation contributes to cancer development and progression and is often associated with a high degree of inflammatory cell infiltration (Singhal et al., 2016). Various cancer types have shown a positive correlation between overall mutational or neoantigen burden and immune infiltration (Karn et al., 2017). Therefore, immune infiltration and mutational burden associated with inflammatory responses are important directions for tumor therapy.
A number of studies on immune infiltration and tumor mutation burden in breast cancer (BC) have been reported, but there are few studies about the relationship between drug sensitivity and inflammatory response (Li et al., 2022; Wang et al., 2022b; Ye, 2022; Zhang et al., 2022a). Inflammatory breast cancer (IBC), which accounts for only 3–5% of all breast cancer cases(Matsuda et al., 2018), contributes to 7–10% of breast cancer-caused mortality(Menta et al., 2018). Despite ongoing international efforts to formulate a better diagnosis and treatment, the survival of patients with IBC has not been significantly improved, and there are no therapeutic agents that specifically target IBC to date (Menta et al., 2018). A good prognostic model can provide not only insights into chemosensitivity and promote breast protection, but also unique prognostic information for the treatment of IBC and BC.
Here, we analyzed the dataset from the TCGA database and two validation cohorts from the GEO databases including 4073 breast cancer patients. We found that an inflammation-related gene signature, which contains 12 genes, could predict the survival in patients with breast cancer. We divided the breast cancer patients into the high-risk group and low-risk group according to the model of these 12 genes. We found that PD.0332991and ROSCOVITINE have higher drug sensitivity to the treatment in low-risk inflammatory breast cancer patients, however, Bicalutamide and Imatinib have higher drug sensitivity in high-risk patients. Our study provides not only insights into the identification of breast cancer patients with poor prognosis, but also prediction of treatment responses in breast cancer patients.
Materials and methods
Data collection
“Inflammatory Response”-related gene sets (Supplementary Hallmark.xlsx) were searched and downloaded from GSEA Gene Set (http://www.gsea-msigdb.org/gsea/msigdb/human/search.jsp). RNA sequencing data for breast cancer were from TCGA (Tumor: n = 1104, Normal: n = 113) and GEO (Tumor: n = 2969). For quality control and standardization, we remove the genes that have zero expression in all samples and only retain the genes expressed in more than half of the samples.
Model construction and evaluation of the 12-IRGs prediction
Fifty-nine genes that related to inflammatory response were obtained by intersecting different genes with |log2Fold Change|≥ 1, P-value < 0.05, and genes with log-rank test analysis P-value < 0.05 and univariate cox P-value < 0.05. Then, Lasso regression analysis was performed on 59 inflammation-dependent genes, and 22 hub genes were screened. A signature was constructed using Cox regression analysis with a lasso penalty to obtain a risk scoring system based on 12 inflammatory-related genes (12-IRGs): risk Score = ∑ (coefi ∗ expi).
Analysis of tumor immune microenvironment
Immune infiltration was analyzed using Cibersort software https://cibersortx.stanford.edu/, and 22 types of immune cells were obtained from the database TISIDB http://cis.hku.hk/TISIDB/download.php. TCGA-BRCA is used to analyze and calculate the abundance of immune cells. All the analysis methods and R package were implemented by R version 4.2.2.
GSEA and GSVA enrichment analysis
Grouping according to the risk score, greater than the average was defined as a high-risk group, and less than the average was a low-risk group. After grouping, the cluster profile (Yu et al., 2012) R package was used for GSEA enrichment analysis and the GSVA (Hänzelmann et al., 2013) R package was utilized for GSVA analysis. All the analysis methods and R package were implemented by R version 4.2.2.
The PPI and similar function gene analysis
The protein–protein interaction and similar function gene analysis were performed using the Gene Main online website https://genemania.org/, and the gene set was 12 hub genes screened by lasso.
Data processing
RNA sequencing data were used to perform differential analysis, and the clinical analysis in log CPM format. Compared with normal tissues, 1906 genes with |long2FoldChange|≥ 1 and P value < 0.05 were screened by using R software limma package (Ritchie et al., 2015) for differential analysis. The same screening conditions were used to assess 136 genes related to inflammation and cancer. Univariate cox regression was used to examine 178 genes with P values less than 0.05. The log-rank test analysis screened 181 genes. R software pRRophetic package was used Drug sensitivity analysis (Geeleher et al., 2014). The R software ggstatsplot package was used to draw the correlations between gene expression and immune score, the R software pheatmap package was used to draw multi-gene expression. Used Spearman’s correlation analysis to describe the correlation between quantitative variables without a normal distribution. P values less than 0.05 were considered statistically significant (*P < 0.05). All the analysis methods and R package were implemented by R version 4.2.2.
Results
Inflammation-related genes differ significantly in breast cancer and normal tissues
To explore the genes that are involved in breast cancer genesis and inflammation-related genes (IRGs) in breast cancer, we performed differential and principal component analyses based on the mRNA levels of 1217 breast cancer patients from the TCGA database, we found that there are significant differences between breast cancer and normal tissues (Fig. 1a, b). We found that 689 genes were significantly up-regulated, and 1217 genes were significantly down-regulated in breast cancers compared to normal tissues (Fig. 1c). Meanwhile, 427 of 1308 genes related to inflammation showed significant differences between breast cancer and normal mammary tissues (Fig. 1d, e). Among them, 213 and 214 genes related to the inflammatory response were up-regulated and down-regulated in breast cancer, respectively, when compared to normal tissues (Fig. 1f). We next performed a survival prognosis assessment based on different tumor stages and ages and found that younger patients with breast cancer had longer survival (Fig. S1a). At the same time, the survival time of patients with stage I or II tumors was longer than that of stage III and IV tumors (Fig. S1b). In tumor node metastasis (TNM) staging, the overall survival of patients also decreased with the degree of stage progression (Fig. S1c, d).
Fig. 1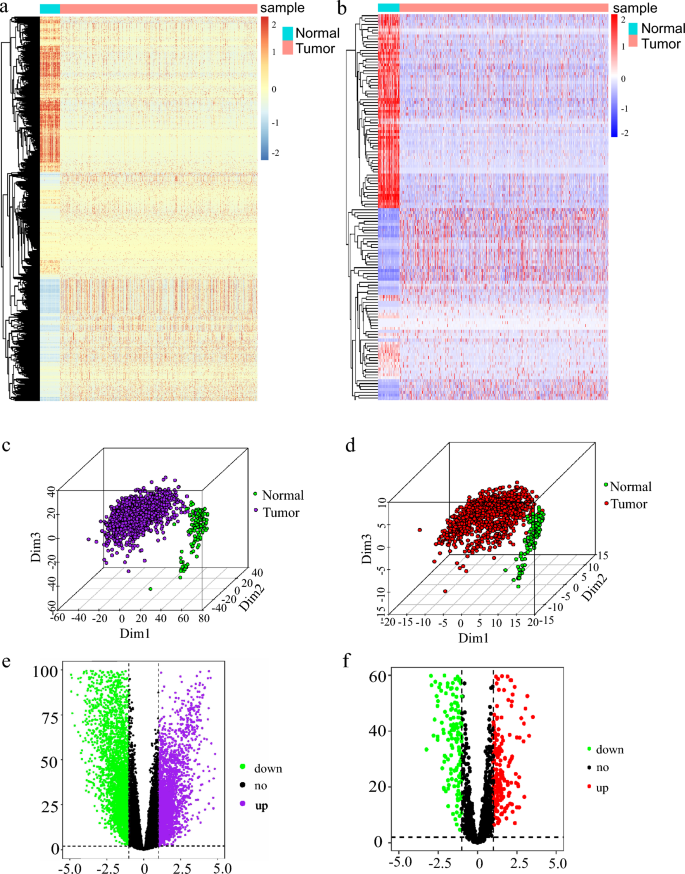
Differential analysis of inflammation-related genes. a Heat map analysis of differential genes in breast cancer. b Heat map analysis of inflammation-related differential genes in breast cancer. c Principal component analysis (PCA) of the differential gene in breast cancer. d Principal component analysis (PCA) of inflammation-related differential genes in breast cancer. e Volcano Map Analysis of differential genes in breast cancer. f Volcano Map Analysis of inflammation-related differential genes in breast cancer
A prognostic model composed of 12 inflammatory response-related genes
We conducted a Log rank test and Univariate Cox analyses on 1308 IRGs. Among them, 118 genes were identified by the Log rank test and 178 genes were detected by Univariate Cox. Then, we got 59 genes from the intersection of the Log rank test, Univariate Cox, and inflammation-related differential genes (IRDGs; Fig. 2a).
Fig. 2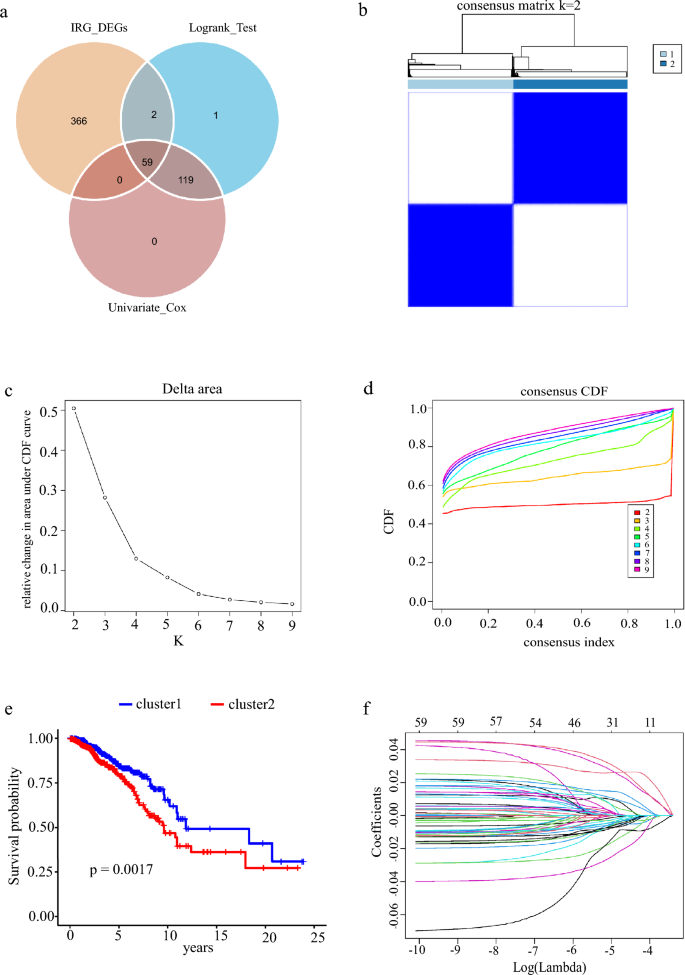
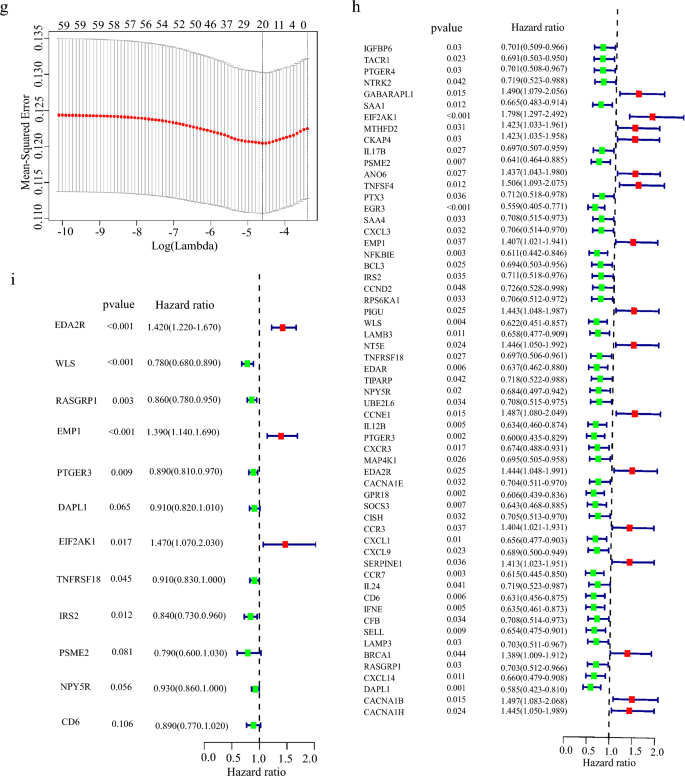
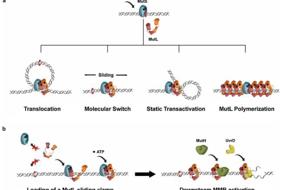
Survival and prognosis model related to inflammation. a Univariate cox regression analysis, log-rank test, and VN map of differential gene intersection of inflammation dependence. b Consensus clustering matrix of the selected 1082 patients according to 59 IRDGs for k = 2. c Relative change in area under the cumulative distribution function (CDF) curve for k = 2–9. d Consensus clustering CDF for k = 2–9. e Survival rate of breast cancer patients in two clusters. f, g LASSO regression curve analysis and cross-validation of 59 IRDGs. h Forest map of univariate cox analysis of 59 IRDGs, 95%CI. i Multivariate cox analysis forest map of 12 modeling genes, 95% CI
Through consensus clustering analysis, we found that IRDGs can be clustered into two groups (Fig. 2b). When K is 2 (Fig. 2c) in a total of nine clustering analyses, the slope of CDF decline was the smallest (Fig. 2d), and the prognosis of breast cancer patients was significantly different (Fig. 2e). According to the results of clustering and grouping, we further showed that the survival time is quite different between different groups, which led us to construct a risk prognosis model. We found that 16 genes were positively associated with, whereas 43 genes were negatively related to overall survival in breast cancer patients (Fig. 2h). After removing the effect of collinearity by Lasso analysis, 22 genes could be used as inflammatory response-dependent prognostic features (Fig. 2f, g). In order to further optimize the model, we used the stepwise regression method to eliminate interference factors, and got the best model containing 12 genes to estimate the survival risk of each patient, the model is as follows: Risk score = 0.35369 × expression of EDA2R + (−0.25247) × expression of WLS + (−0.15276) × expression of RASGRP1 + 0.33080 × expression of EMP1 + (−0.12058) × expression of PTGER3 + (−0.09659) × expression of DAPL1 + 0.38817 × expression of EIF2AK1 + (−0.09533) × expression of TNFRSF18 + (−0.17530) × expression of IRS2 + (−0.24169) × expression of PSME2 + (−0.07606) × expression of NPY5R + (−0.11625) × expression of CD6 (Fig. 2i).
The risk score demonstrates excellent predictive performance across different subtypes of breast cancer
Due to the heterogeneity of breast cancer, the diagnosis and treatment of different subtypes face great challenges (Geurts & Kok, 2023; Munkácsy et al., 2023; Popović et al., 2023; Subhan et al. 2023; Xu et al., 2023). While inflammation has been extensively studied across various cancers and has been highly correlated with different treatment outcomes, the relationship between inflammation and cancer remains relatively obscure. Our model exhibits remarkable predictive performance not only for breast cancer overall but also for the distinct subtypes of the disease. We evaluated the prognostic outcomes of subtypes of breast cancer classified via two different methods, IHC and PAM50. Within the IHC classification, patients with ER + /HER2−, ER + /HER2 + , and HER2 subtypes exhibited significant differences in risk score-based patient outcomes (Fig. 3a–d). Likewise, in the PAM50 classification, patients with Her2, Luminal A, and Normal subtypes demonstrated significant differences in survival rates for different risk groups (Fig. 3e–i).
Fig. 3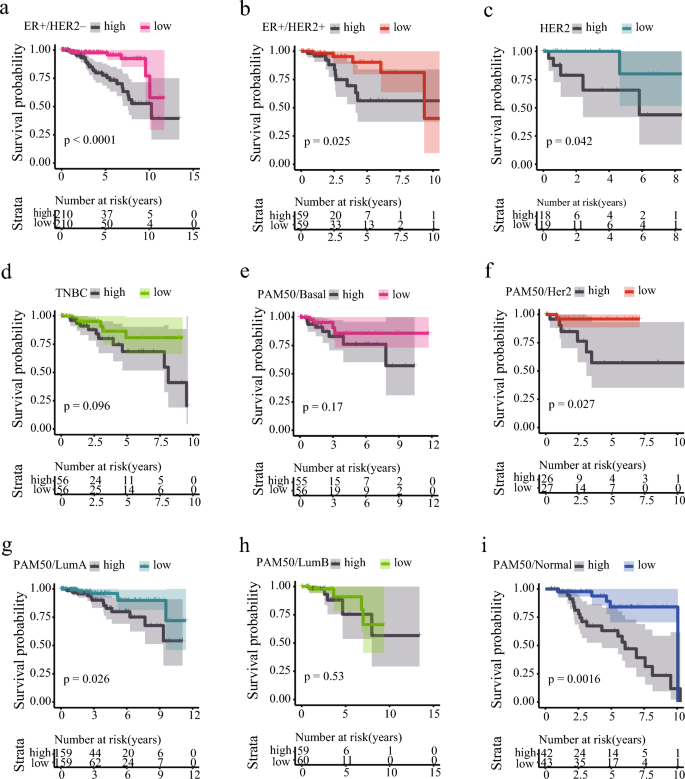
Prognosis of Breast Cancer with Different Subtypes Based on Risk Scores. a Kaplan–Meier curves of ER-positive/PR-positive/HER2-negative subtype of breast cancer in different risk groups. b Kaplan–Meier curves of ER-positive/PR-positive/HER2-positive subtype of breast cancer in different risk groups. c Kaplan–Meier curves of ER-negative/PR-negative/HER2-positive subtype of breast cancer in different risk groups. d Kaplan–Meier curves of ER-negative/PR-negative/HER2-negative subtype of breast cancer in different risk groups. e Kaplan–Meier curves of PAM50 Basal-like subtype of breast cancer in different risk groups. f Kaplan–Meier curves of PAM50 Her2 subtype of breast cancer in different risk groups. g Kaplan–Meier curves of PAM50 Luminal A subtype of breast cancer in different risk groups. h Kaplan–Meier curves of PAM50 Luminal B subtype of breast cancer in different risk groups. i Kaplan–Meier curves of PAM50 Normal subtype of breast cancer in different risk groups
Inflammation-related gene signature enables assessment of patient survival
To investigate whether the 12 inflammation-related gene signatures could be used to evaluate the survival rate of breast cancer patients, we grouped the patients into high-risk and low-risk groups according to the model. After excluding the effect of gene collinearity, we found that the expression levels of EDA2R (Ectodysplasin A2 Receptor), EMP1 (Epithelial Membrane Protein 1) and EIF2AK1 (Eukaryotic Translation Initiation Factor 2 Alpha Kinase 1) were abnormally elevated in the high-risk group (Fig. 4a–c). Previous studies showed that EDA2R acted as a risk factor in different cancers to promote occurrence (Deryusheva et al., 2017; Ge et al., 2021; Jia et al., 2021). EMP1, which negatively regulates autophagy-dependent apoptosis(Wang et al., 2022a), plays an important role in the immune infiltration and tumor cell invasion and metastasis(Ahmat Amin et al., 2019; Cha & Koo, 2020a, 2020b; Kim & Koo, 2022; Lin et al., 2020; Sato et al., 2021; Wang et al., 2017, 2019, 2020a). EIF2AK1 was reported to be involved in drug resistance in breast cancer (Zhang et al., 2018). Our results further indicate that high expression of these genes is associated with the poor prognosis in patients with high-risk group (Fig. 4d–l). Meanwhile, we found that DAPL1 (Death Associated Protein Like 1), PSME2 (Proteasome Activator Subunit 2), CD6 (T-Cell Differentiation Antigen CD6), WLS (Wnt Ligand Secretion Mediator), PTGER3 (Prostaglandin E Receptor 3), RASGRP1 (RAS Guanyl Releasing Protein 1), IRS2 (Insulin Receptor Substrate 2), NPY5R (Neuropeptide Y Receptor Y5), and TNFRSF18 (Glucocorticoid-induced tumor necrosis factor receptor- superfamily Member 18) were significantly decreased in the high-risk group (Fig. 4f–k). DAPL1 was reported to negatively regulate CD8 T cell response to tumorigenesis and the depletion of DAPL1 leading to enhancing the functionality of TEX cells (Zhu et al., 2022). The differential expression of PTGER3 was shown to relate to drug resistance in breast cancer (Panossian et al., 2019; Rodriguez-Aguayo et al., 2019, 2022). CD6 and PSEM2 were also reported to be associated with immune infiltration and tumor microenvironment (Ogiwara et al., 2022; Ruth et al., 2021; Wang et al., 2020b, 2021; Zhang et al., 2022b). It is well recognized that tumor-associated macrophages (TAMs) include two major populations: tumor-supportive M2 macrophages and tumor-suppressive M1 macrophages, although each population may contain subpopulations (Tao et al., 2020). In tumor immunity, the activation and phosphorylation of IRS2 by IL4 inhibits the activation of M2 macrophages. Similarly, WLS has the same function, and its deletion upregulates the expression of inflammation-related genes (Augustin et al., 2013) and activates M2 macrophage activity (Palevski et al., 2017). RASGRP1 is associated with congenital immunodeficiency, and its deletion leads to severe recurrent infections, autoimmunity, autoinflammation, and early onset malignancies (Sacco et al., 2022). NPY5R limited the activation of the STAT3 signaling pathway through interaction with IL6, simultaneously inhibited the growth of breast tumor cells, induced apoptosis and G2/M arrest, and increased the sensitivity of BC cells to doxorubicin (Liu et al., 2021). TNFRSF18 is highly expressed in low-risk breast cancer and has a good prognosis. We demonstrated that low expression of these immune-related genes was linked to the poor prognosis of patients in the high-risk group (Fig. 4m–x). Furthermore, we found significant differences between high- and low-risk groups in the TNM stage and tumor stage (Fig. S3a–d).
Fig. 4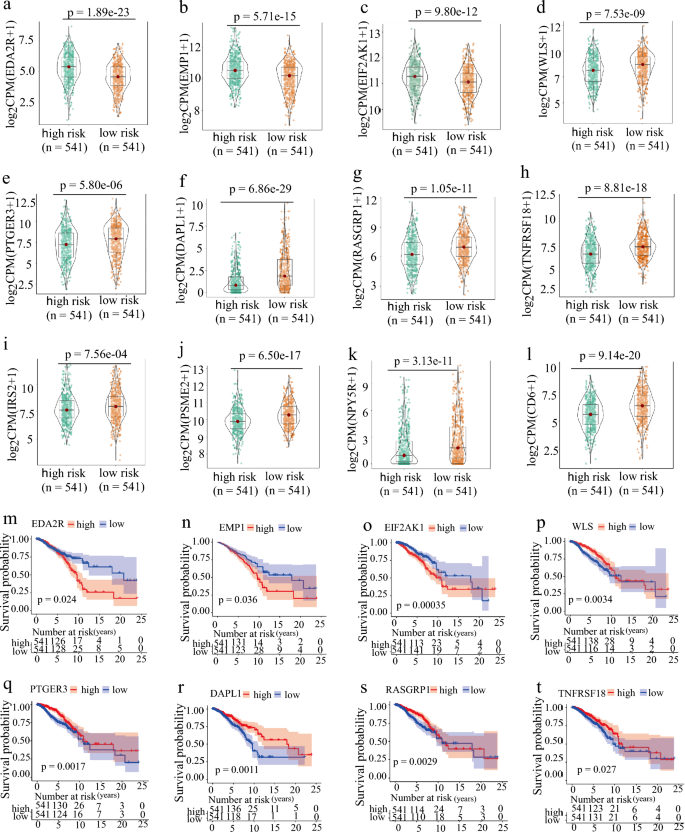
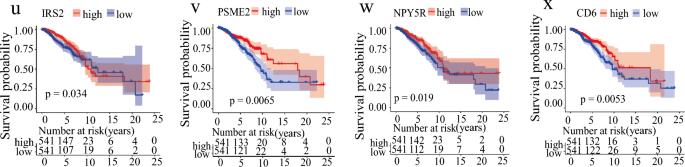
Expression and survival curve of hub genes in risk groups. a–l The IRGs expression is grouped according to the risk score. m–x The survival curve of IRGs is grouped according to the risk score
Inflammation-dependent prognostic model can predict patient survival
In order to ensure the accuracy of the model, we used the training set (TCGA-BRCA, n = 1104) to predict the life and death of the testing set (GSE96058, n = 2969). We found that the number of patient deaths in the high-risk group was significantly higher than that of the low-risk group (Fig. 5a–c) and testing sets (Fig. 5d–f). According to the KM survival curve, this model worked well in both the training (Fig. 5g) and testing sets (Fig. 5i), indicating that our model is reliable. We also calculated the AUC values for the1, 3, 5, 10 and 15-year survival in training sets (Fig. 5h) and the AUC values for the 1, 3 and 5 years in testing sets (Fig. 5j). The results showed that the risk score AUC value in the training set were almost above 0.7 and the risk score AUC values in test set were also almost above 0.6 according to the model, indicating that the inflammatory-related risk signature could be used to predict the survival of breast cancer patients.
Fig. 5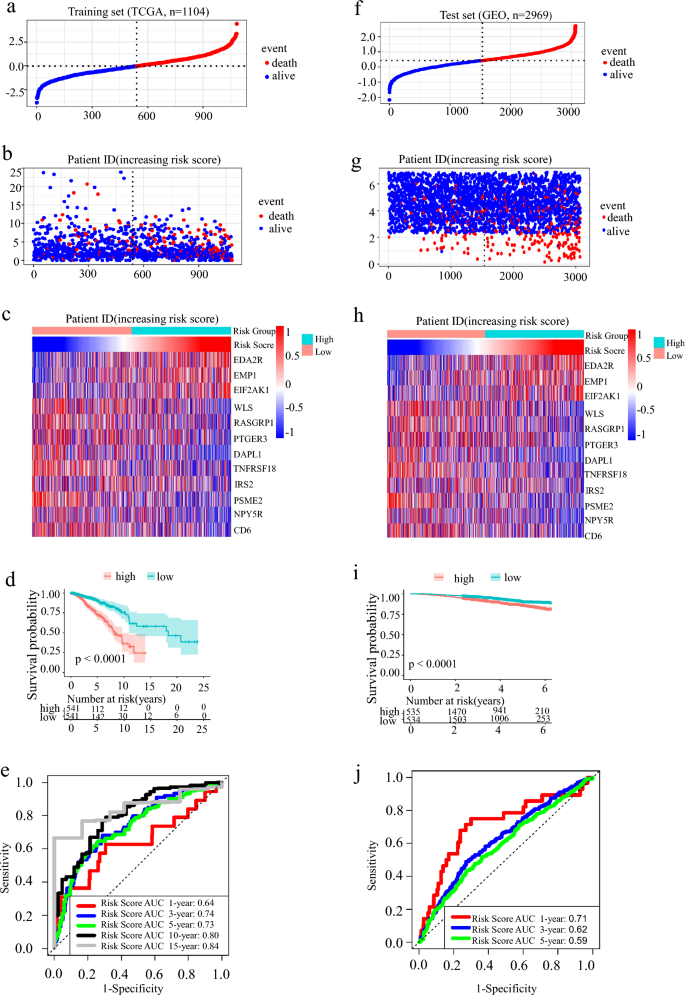
Construction, distribution, and validation of IRGs. a Population distribution based on the inflammation-related risk score. b Scatter plot shows the difference in survival status between the high-risk group and low-risk group IBC patients. c The heat map showed the differential expression of 12 inflammation-related hub genes in the 2 groups. d The total survival time (OS) of IBC patients in the high-risk group was significantly shorter than that in the low-risk group. e The ROC curve area and AUC value of the training group in 1, 3, 5, 10, and 15 years. f–g The results of verified in the test group GSE96058
Risk score and nomogram can predict the prognosis of breast cancer patients
Univariate and multivariate cox regression analyses revealed that tumor stage, TNM stage, age, and Risk Score were the factors that influence the survival in breast cancer patients and that Risk Score and tumor stage were independent factors (Fig. 6a–d). We further constructed Nomograms in the training set (Fig. 6e) and testing set (Fig. 6g) according to the Risk Score. We found that the higher the Risk Score, the lower the survival rates of patients. Calibration showed that Nomogram is more accurate (Fig. 6f–h).
Fig. 6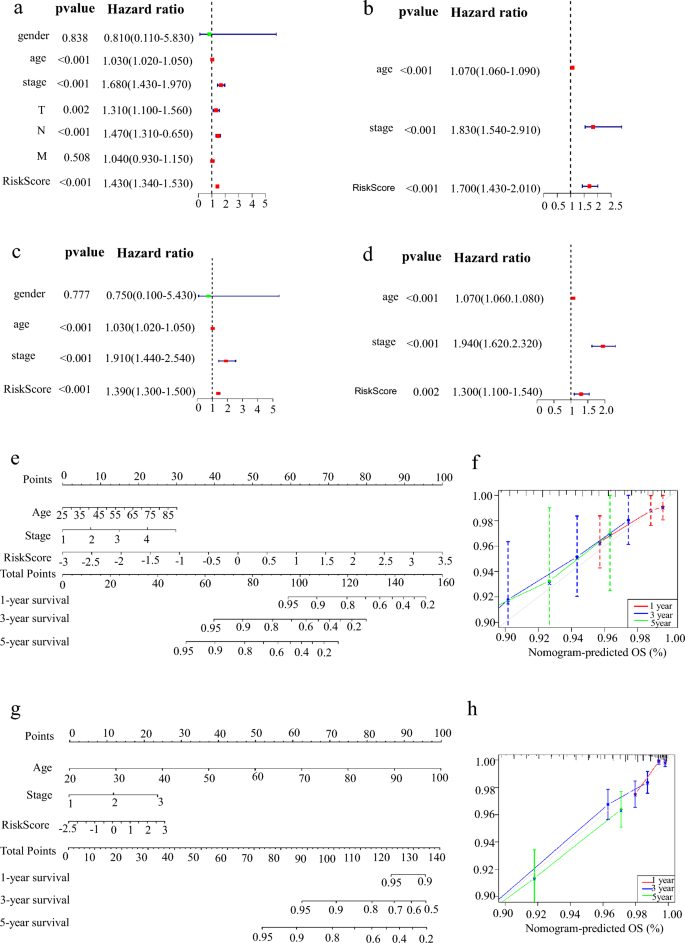
Nomogram is used to predict the survival rate of patients with IBC. a Gender, age, stage, T, N, M, and Risk Score univariate cox analysis of the training group. b Age, stage and Risk Score univariate cox analysis of the test group; GSE96058 has no clinical information on T, N, M, and gender. c Gender, age, stage, T, N, M, and Risk Score Multivariate Cox analysis of the training group. d Age, stage, and Risk Score Multivariate cox analysis of the test group. e The nomogram of the training group for 1, 3, and 5 years to predict the survival probability of patients. f The calibration curves of the training group for 1, 3, and 5 years are used to evaluate the accuracy of the model. g The nomogram of the test group for 1, 3, and 5 years to predict the survival probability of patients. h The calibration curves of the test group for 1, 3, and 5 years are used to evaluate the accuracy of the model
High-risk group has inflammation or chronic inflammation, while the low-risk group inactivates the MAPK and calcium ion signaling pathways
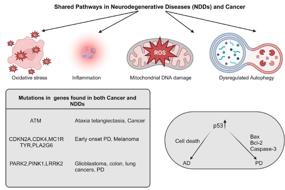
To analyze the relationship between the high-risk group and inflammation, we performed KEGG and GO enrichment analysis of GSEA in high-risk and low-risk patients. We found that nine KEGG signaling pathways, including inflammation and immune deficiency, were enriched in the high-risk group (Fig. 7a). Similarly, GO analysis revealed that the signaling pathways such as chronic inflammation, inflammatory response, interferon, and chemokines were also activated in the high-risk group (Fig. 7b). This suggested that inflammatory reactions are occurring in the high-risk group. However, the MAPK signaling pathway and calcium ion signaling pathway were inhibited in the low-risk group (Fig. 7c). Endogenous stimuli from the TME or cancer cells were also inhibited in the GO signaling pathway (Fig. 7d). These findings further support our observation that the patients in the high-risk group had lower survival rates. Hallmarks co-expression network and GENEMANIA analyses showed that inflammatory response-related signaling pathways were enriched and that 12 inflammation-related genes were co-expressed (Fig. 7e–f).
Fig. 7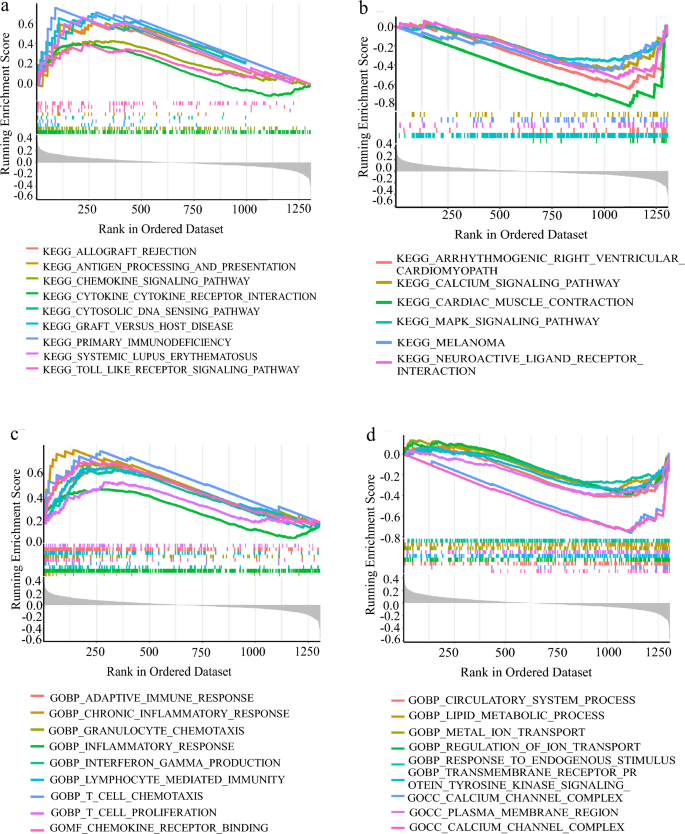
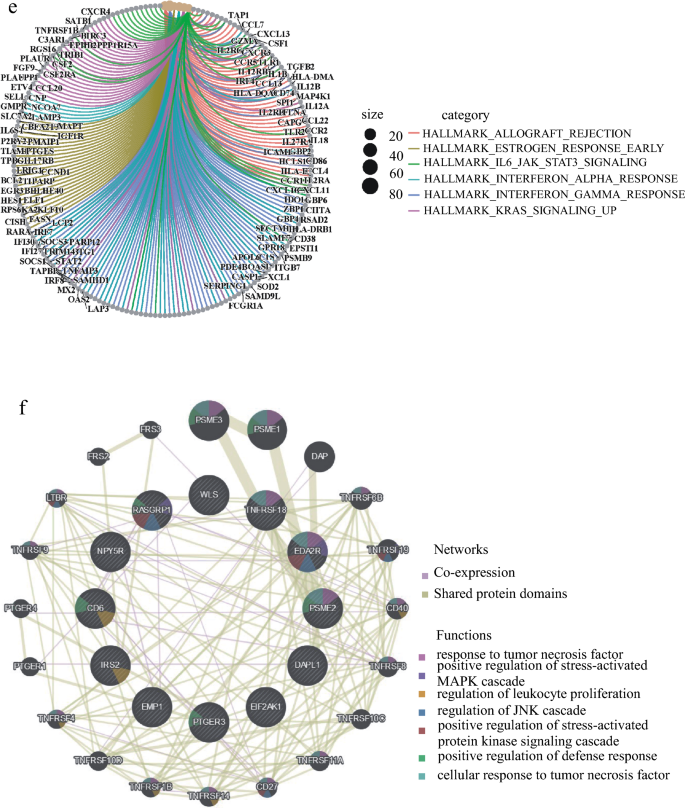
High-risk group had inflammation or chronic inflammation, enrichment analysis of KEGG and GO and co-expression analysis of IRGs in GSEA. a, b According to the KEGG enrichment analysis of GSEA, higher than the average value of Risk Score is a high-risk group, lower than the average value is a low-risk group, A. B is the KEGG signal pathway enriched by high-risk group and low-risk group in turn. c, d The GO enrichment analysis of GSEA is grouped according to Risk Score. e The Hallmarks co-expression analysis of GSEA ranked the top six signal pathways. f Protein–protein interactions (Wolf et al.) of hub genes at the Gene MANIA. The 20 functionally similar genes were located in the outer circle, while hub genes were located in the inner circle. The color of nodes was related to the protein function while line color represented the type of protein interaction
High-risk group has higher macrophage M2 infiltration and lower memory T cells
In order to study the immune cells in mammary tumorigenesis, we analyzed the overall proportion of different immune cells. Among the 22 types of immune cells, memory CD4 T cells and M2-macrophage had the highest abundance (Fig. 8a). Many studies have shown that the accumulation of M2-macrophage promotes tumor blood vessel formation and tumor cell proliferation, while M1-macrophage inhibited tumor growth (Cervantes-Villagrana et al., 2020; Liu et al., 2019; Ruella et al., 2017; Shields et al., 2020). We next analyzed the levels of 22 immune cells in patients with different risk groups and found that macrophages M0, M2, and mast cells were higher in the high-risk group, while macrophages M1, T cells, B cells, and Monocytes were higher in the low-risk group (Fig. 8b). According to the previous report (Li et al., 2019), we divided 22 types of immune cells into four groups: lymphocytes, dendritic cell, macrophage and mast cell, and then analyzed them in different risk patients individually. The results showed that there were more macrophages and mast cells in the high-risk group patients, while there were more lymphocytes in the low-risk group (Fig. 8c). Previous reports have shown that excessive or uncontrolled macrophage accumulation contributes to chronic inflammation and occurrence of different diseases (Yakubenko et al., 2018). Therefore, we analyzed the abundance of 22 immune cells based on the risk score and clinical information. The results strongly indicated that the risk score could classify immune cells and the abundance of immune cells in different risk groups (Fig. 8d). Our results suggest that M2-macrophages are important factors for the poor survival rate in the high-risk group patients.
Fig. 8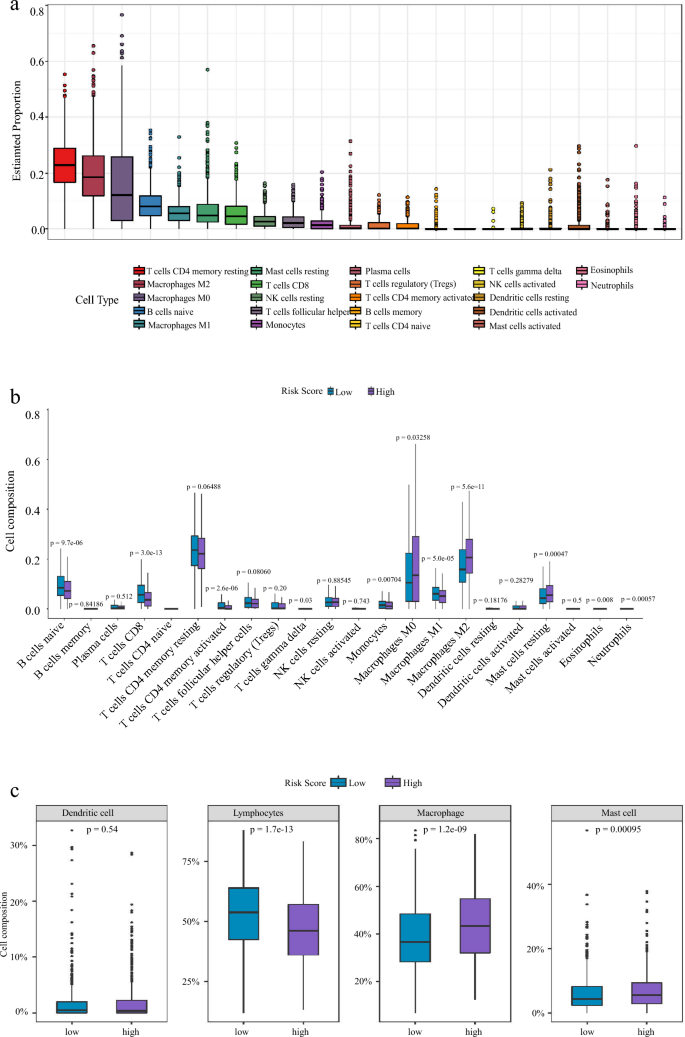
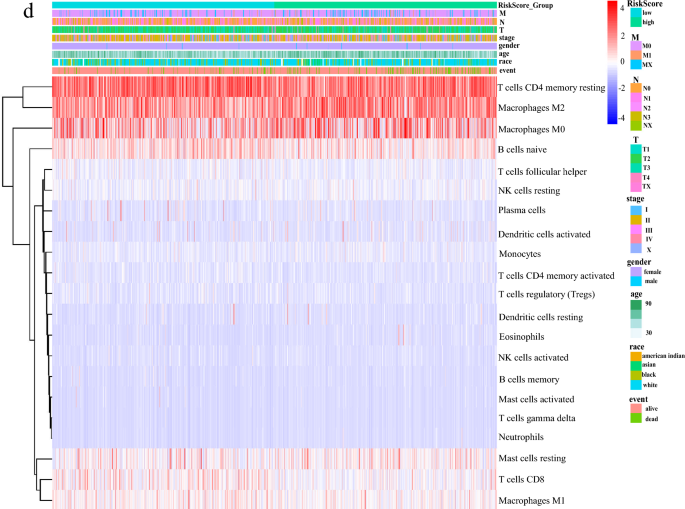
High-risk group has higher macrophage M2 infiltration and lower memory T cells Differential distributions of immune cells in two IRGs groups. a Percentage and content of 22 kinds of immune cells in breast cancer. b Wilcoxon rank-sum test accurately compared the difference and indicated that several immune cells conferred significantly lower infiltrating density in high-risk groups. *P < 0.05; **P < 0.01; ***P < 0.001, statistically significant. c The expression calorimetry of each immune cell was grouped according to clinical data and risk score. d The 20 types of immune cells calculated by Cibersort were divided into four major groups and their expression levels were calculated in different risk groups: Total lymphocytes, Total dendritic cell, Total macrophage and Total mast cell
High-risk group has higher tumor mutational burden (TMB) and higher drug sensitivity to Bicalutamide and Imatinib
High tumor mutational burden (TMB) and neoantigen load in tumors have been associated with an enhanced response to immune checkpoint blockade therapy (Wolf et al., 2019). In order to confirm the somatic mutation differences in our defined high- and low-risk groups, we downloaded the somatic mutation data and performed tumor mutation burden analysis. We also analyzed amino acid mutation site, drug–gene interaction, oncogenic signal pathway, and drug sensitivity. The results showed that SNP deletion mutations are the most common in breast cancer (Fig. 9a, b, S3a–b). The mutation frequency of the TTN and GATA3 genes was higher in the high-risk group, while the mutation frequency of TP53, PIK3CA, and CDH1 was higher in the low-risk group (Fig. 9c, S3c–h). Inflammation-related hub gene mutation frequency in the high-risk group was higher than in the low-risk group (Fig. S3i). And there was a higher TMB in the high-risk group (Fig. 9d,e). We further predicted potential drug signaling pathways based on gene mutation frequencies and biological functions (Fig. S3g–m). It is well known that the sensitivity to chemotherapeutic drugs significantly affects the treatment outcome of patients. Through drug screening, we found that PD.0332991, ROSCOVITINE, and risk score were significantly positively correlated (Fig. 9f–i), and the treatment effect was better for low-risk patients. Bicalutamide, Imatinib, and RISK Score were negatively correlated (Fig. 9j–m), and the treatment effect was better in high-risk patients.
Fig. 9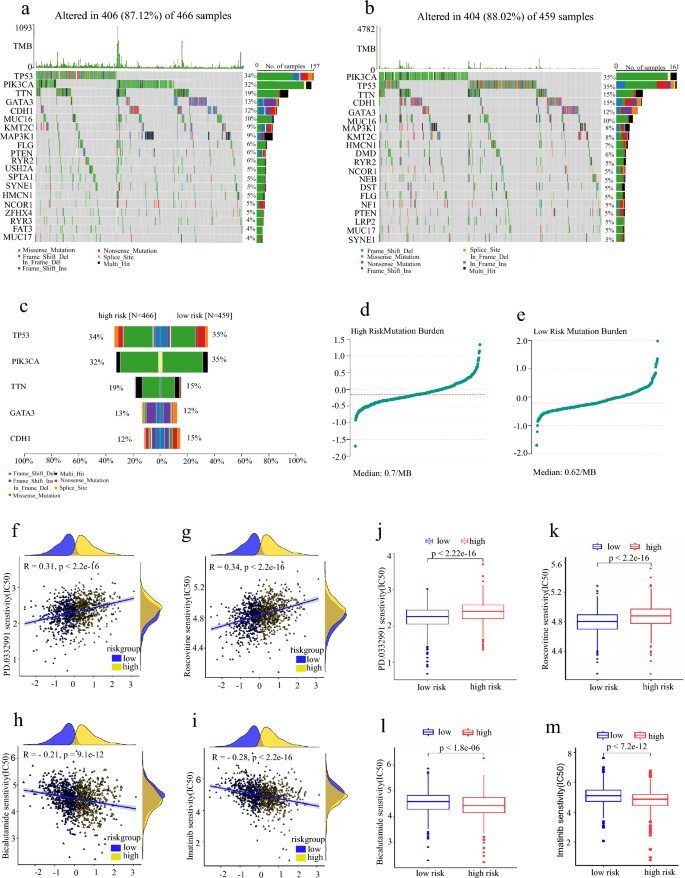
High-risk group has higher tumor mutational burden (TMB) and higher drug sensitivity to Bicalutamide and Imatinib Analysis of tumor mutational burden and drug sensitivity. a Waterfall maps of the somatic mutations in the high-risk group. b Waterfall maps of the somatic mutations in the low-risk group. c Comparison plot of the top five genes with mutation frequency. d Tumor mutation burden in the high-risk group. e Tumor mutation burden in a low-risk group. f–i The two groups compared the PD.0332991, Roscovitine, Bicalutamide, and Imatinib sensitivity (IC50). j–m The relationship between risk score and PD.0332991, Roscovitine, Bicalutamide, and Imatinib sensitivity (IC50)
Discussion
Inflammation, as a way of the body’s immune response, plays an important role in tumorigenesis, progression and metastasis. Increased levels of inflammation are associated with many diseases including cancer (Haley et al., 2020). Chronic inflammation increases the risk of cancer (Cobo et al., 2018). Cancer-associated systemic inflammation is strongly linked to poor disease outcomes in cancer patients (Wellenstein et al., 2019). Therefore, inflammation was recognized as one of the hallmarks of cancer (Aran et al., 2016) and was a risk factor for cancer development (Cai et al., 2018).
Drug resistance remains problematic despite advances in cancer biology and therapeutics (Konieczkowski et al., 2018). Most patients with advanced breast cancer develop drug resistance (Lee et al., 2017). Chemotherapy resistance is a major barrier for breast cancer treatment, and strategies to circumvent resistance are required (Brown et al., 2017). Tumors evade the immune system by inducing inflammation (Hammoudeh et al., 2020). In the early stages of tumor development, the immune response exerts anti-tumor activity, whereas in the advanced stages, the tumor establishes mechanisms to evade the immune response, thus eliciting a chronic inflammation process that shows a pro-tumor effect (Aguilar-Cazares et al., 2022). Cancer evolution in response to immune control is a hallmark of cancer and it is well recognized that the tumor-specific immune microenvironment shapes the neoantigen repertoire found in tumors (Lakatos et al., 2020). The changes in inflammation and tumor biomarkers are associated with the anti-tumor immunological processes. Early detection and intervention are of great significance to the clinical management of cancer (Yu et al., 2022).
However, inflammatory signatures are currently rarely used to classify and predict patient outcomes and to guide chemotherapy regimens. In our study, we grouped breast cancer patients by 12 inflammatory genes, and then predicted the accuracy in other databases. We also analyzed TMB, immune infiltration, and susceptibility to different drugs in different groups of patients, our analysis indicated that high level of macrophage M2 was found in the high-risk group with poor prognosis. Intriguingly, in our unpublished study, we found that Dguok (Deoxyguanosine Kinase) knock-out mediated mitochondria dysfunction and inhibited breast carcinogenesis (Han and Sun, unpublished data), and TNFSF18 expression was significantly up-regulated in DGUOK knock-out MCF-7 breast cancer cells when compared to control cells, which implied the reliability of our prediction model. We also found that different risk groups respond differently to different drugs. Our study provided an inflammatory gene signature, which is closely associated with prognosis and predicts the therapeutic efficiency of patients with breast cancer.
Conclusion
Breast cancer is a significant health concern. Chemotherapy is a commonly used modality for the treatment. Our results demonstrate that BRCA can be differentiated into high-risk and low-risk groups based on the level of inflammation, resulting in distinct tumor immune microenvironments, prognoses, and drug sensitivities. The validity of our classification has been confirmed through additional data sets, thus validating its reliability. The high-risk group of breast cancer patients is characterized by elevated macrophage abundance, indicative of heightened inflammation and a poor prognosis. An analysis of TMB and drug sensitivity indicates that PD.0332991 and ROSCOVITINE exhibit higher sensitivity to the treatment of low-risk inflammatory breast cancer, while Bicalutamide and Imatinib display greater efficacy in the treatment of high-risk patients. In light of these findings, we have developed a nomogram to predict the survival probability of breast cancer patients and provide customized chemotherapy treatment plans for individuals in different risk groups. These results may benefit future clinical approaches to the treatment of breast cancer.
Data availability
The data for the test set was obtained from the Gene Expression Omnibus (GEO) database under accession number GSE96058 and is accessible at the following URL: https://www.ncbi.nlm.nih.gov/geo/query/acc.cgi?acc=GSE96058. The data for the training set was acquired from The Cancer Genome Atlas (TCGA) database under accession number TCGA-BRCA and can be accessed at the following URL: https://portal.gdc.cancer.gov/repository.
References
Aguilar-Cazares, D., Chavez-Dominguez, R., Marroquin-Muciño, M., Perez-Medina, M., Benito-Lopez, J. J., Camarena, A., Rumbo-Nava, U., & Lopez-Gonzalez, J. S. (2022). The systemic-level repercussions of cancer-associated inflammation mediators produced in the tumor microenvironment. Frontiers in Endocrinology, 13, 929572. https://doi.org/10.3389/fendo.2022.929572
Ahmat Amin, M. K. B., Shimizu, A., & Ogita, H. (2019). The pivotal roles of the epithelial membrane protein family in cancer invasiveness and metastasis. Cancers, 11(11), 1620. https://doi.org/10.3390/cancers11111620
Akbay, E. A., Koyama, S., Liu, Y., Dries, R., Bufe, L. E., Silkes, M., Alam, M. M., Magee, D. M., Jones, R., Jinushi, M., Kulkarni, M., Carretero, J., Wang, X., Warner-Hatten, T., Cavanaugh, J. D., Osa, A., Kumanogoh, A., Freeman, G. J., Awad, M. M., … Wong, K. K. (2017). Interleukin-17A promotes lung tumor progression through neutrophil attraction to tumor sites and mediating resistance to PD-1 blockade. Journal of Thoracic Oncology: Official Publication of the International Association for the Study of Lung Cancer, 12(8), 1268–1279. https://doi.org/10.1016/j.jtho.2017.04.017
Aran, D., Lasry, A., Zinger, A., Biton, M., Pikarsky, E., Hellman, A., Butte, A. J., & Ben-Neriah, Y. (2016). Widespread parainflammation in human cancer. Genome Biology, 17(1), 145. https://doi.org/10.1186/s13059-016-0995-z
Augustin, I., Gross, J., Baumann, D., Korn, C., Kerr, G., Grigoryan, T., Mauch, C., Birchmeier, W., & Boutros, M. (2013). Loss of epidermal Evi/Wls results in a phenotype resembling psoriasiform dermatitis. The Journal of Experimental Medicine, 210(9), 1761–1777. https://doi.org/10.1084/jem.20121871
Brown, K. K., Spinelli, J. B., Asara, J. M., & Toker, A. (2017). Adaptive reprogramming of de novo pyrimidine synthesis is a metabolic vulnerability in triple-negative breast cancer. Cancer Discovery, 7(4), 391–399. https://doi.org/10.1158/2159-8290.Cd-16-0611
Cai, Z., Kotzin, J. J., Ramdas, B., Chen, S., Nelanuthala, S., Palam, L. R., Pandey, R., Mali, R. S., Liu, Y., Kelley, M. R., Sandusky, G., Mohseni, M., Williams, A., Henao-Mejia, J., & Kapur, R. (2018). Inhibition of inflammatory signaling in Tet2 mutant preleukemic cells mitigates stress-induced abnormalities and clonal hematopoiesis. Cell Stem Cell, 23(6), 833-849.e835. https://doi.org/10.1016/j.stem.2018.10.013
Cervantes-Villagrana, R. D., Albores-García, D., Cervantes-Villagrana, A. R., & García-Acevez, S. J. (2020). Tumor-induced neurogenesis and immune evasion as targets of innovative anti-cancer therapies. Signal Transduction and Targeted Therapy, 5(1), 99. https://doi.org/10.1038/s41392-020-0205-z
Cha, Y. J., & Koo, J. S. (2020a). Expression and role of epithelial membrane proteins in tumorigenesis of hormone receptor-positive breast cancer. Journal of Breast Cancer, 23(4), 385–397. https://doi.org/10.4048/jbc.2020.23.e42
Cha, Y. J., & Koo, J. S. (2020b). Expression of EMP1, EMP2, and EMP3 in breast phyllodes tumors. PloS One, 15(8), e0238466. https://doi.org/10.1371/journal.pone.0238466
Cobo, I., Martinelli, P., Flández, M., Bakiri, L., Zhang, M., Carrillo-de-Santa-Pau, E., Jia, J., Sánchez-Arévalo Lobo, V. J., Megías, D., Felipe, I., Del Pozo, N., Millán, I., Thommesen, L., Bruland, T., Olson, S. H., Smith, J., Schoonjans, K., Bamlet, W. R., Petersen, G. M., … Real, F. X. (2018). Transcriptional regulation by NR5A2 links differentiation and inflammation in the pancreas. Nature, 554(7693), 533–537. https://doi.org/10.1038/nature25751
Deryusheva, I. V., Tsyganov, M., Garbukov, E. Y., Ibragimova, M. K., Kzhyshkovska, J. G., Slonimskaya, E., Cherdyntseva, N. V., & Litviakov, N. V. (2017). Genome-wide association study of loss of heterozygosity and metastasis-free survival in breast cancer patients. Experimental Oncology, 39(2), 145–150.
Dinarello, C. A. (2010). Anti-inflammatory agents: Present and future. Cell, 140(6), 935–950. https://doi.org/10.1016/j.cell.2010.02.043
Ge, S., Hua, X., Chen, J., Xiao, H., Zhang, L., Zhou, J., Liang, C., & Tai, S. (2021). Identification of a costimulatory molecule-related signature for predicting prognostic risk in prostate cancer. Frontiers in Genetics, 12, 666300. https://doi.org/10.3389/fgene.2021.666300
Geeleher, P., Cox, N., & Huang, R. S. (2014). pRRophetic: An R package for prediction of clinical chemotherapeutic response from tumor gene expression levels. PloS One, 9(9), e107468. https://doi.org/10.1371/journal.pone.0107468
Geurts, V., & Kok, M. (2023). Immunotherapy for metastatic triple negative breast cancer: Current paradigm and future approaches. Current Treatment Options in Oncology, 24(6), 628–643. https://doi.org/10.1007/s11864-023-01069-0
Greten, F. R., & Grivennikov, S. I. (2019). Inflammation and cancer: Triggers, mechanisms, and consequences. Immunity, 51(1), 27–41. https://doi.org/10.1016/j.immuni.2019.06.025
Haley, J. S., Hibler, E. A., Zhou, S., Schmitz, K. H., & Sturgeon, K. M. (2020). Dose-dependent effect of aerobic exercise on inflammatory biomarkers in a randomized controlled trial of women at high risk of breast cancer. Cancer, 126(2), 329–336. https://doi.org/10.1002/cncr.32530
Hammoudeh, S. M., Venkatachalam, T., Ansari, A. W., Bendardaf, R., Hamid, Q., Rahmani, M., & Hamoudi, R. (2020). Systems immunology analysis reveals an immunomodulatory effect of Snail-p53 binding on neutrophil- and T cell-mediated immunity in KRAS mutant non-small cell lung cancer. Frontiers in Immunology, 11, 569671. https://doi.org/10.3389/fimmu.2020.569671
Hänzelmann, S., Castelo, R., & Guinney, J. (2013). GSVA: gene set variation analysis for microarray and RNA-seq data. BMC Bioinformatics, 14, 7. https://doi.org/10.1186/1471-2105-14-7
Jia, R., Sui, Z., Zhang, H., & Yu, Z. (2021). Identification and validation of immune-related gene signature for predicting lymph node metastasis and prognosis in lung adenocarcinoma. Frontiers in Molecular Biosciences, 8, 679031. https://doi.org/10.3389/fmolb.2021.679031
Karn, T., Jiang, T., Hatzis, C., Sänger, N., El-Balat, A., Rody, A., Holtrich, U., Becker, S., Bianchini, G., & Pusztai, L. (2017). Association between genomic metrics and immune infiltration in triple-negative breast cancer. JAMA Oncology, 3(12), 1707–1711. https://doi.org/10.1001/jamaoncol.2017.2140
Kim, E. K., & Koo, J. S. (2022). Expression of epithelial membrane protein (EMP) 1, EMP 2, and EMP 3 in thyroid cancer. Histology and Histopathology, 37(1), 51–61. https://doi.org/10.14670/hh-18-378
Konieczkowski, D. J., Johannessen, C. M., & Garraway, L. A. (2018). A convergence-based framework for cancer drug resistance. Cancer Cell, 33(5), 801–815. https://doi.org/10.1016/j.ccell.2018.03.025
Lakatos, E., Williams, M. J., Schenck, R. O., Cross, W. C. H., Househam, J., Zapata, L., Werner, B., Gatenbee, C., Robertson-Tessi, M., Barnes, C. P., Anderson, A. R. A., Sottoriva, A., & Graham, T. A. (2020). Evolutionary dynamics of neoantigens in growing tumors. Nature Genetics, 52(10), 1057–1066. https://doi.org/10.1038/s41588-020-0687-1
Lee, K. M., Giltnane, J. M., Balko, J. M., Schwarz, L. J., Guerrero-Zotano, A. L., Hutchinson, K. E., Nixon, M. J., Estrada, M. V., Sánchez, V., Sanders, M. E., Lee, T., Gómez, H., Lluch, A., Pérez-Fidalgo, J. A., Wolf, M. M., Andrejeva, G., Rathmell, J. C., Fesik, S. W., & Arteaga, C. L. (2017). MYC and MCL1 cooperatively promote chemotherapy-resistant breast cancer stem cells via regulation of mitochondrial oxidative phosphorylation. Cell Metabolism, 26(4), 633-647.e637. https://doi.org/10.1016/j.cmet.2017.09.009
Li, B., Cui, Y., Nambiar, D. K., Sunwoo, J. B., & Li, R. (2019). The immune subtypes and landscape of squamous cell carcinoma. Clinical Cancer Research: An Official Journal of the American Association for Cancer Research, 25(12), 3528–3537. https://doi.org/10.1158/1078-0432.Ccr-18-4085
Li, H., Liu, H., Hao, Q., Liu, X., Yao, Y., & Cao, M. (2022). Oncogenic signaling pathway-related long non-coding RNAs for predicting prognosis and immunotherapy response in breast cancer. Frontiers in Immunology, 13, 891175. https://doi.org/10.3389/fimmu.2022.891175
Lin, B., Zhang, T., Ye, X., & Yang, H. (2020). High expression of EMP1 predicts a poor prognosis and correlates with immune infiltrates in bladder urothelial carcinoma. Oncology Letters, 20(3), 2840–2854. https://doi.org/10.3892/ol.2020.11841
Liu, J., Wang, X., Sun, J., Chen, Y., Li, J., Huang, J., Du, H., Gan, L., Qiu, Z., Li, H., Ren, G., & Wei, Y. (2021). The novel methylation biomarker npy5r sensitizes breast cancer cells to chemotherapy. Frontiers in Cell and Developmental Biology, 9, 798221. https://doi.org/10.3389/fcell.2021.798221
Liu, M., O’Connor, R. S., Trefely, S., Graham, K., Snyder, N. W., & Beatty, G. L. (2019). Metabolic rewiring of macrophages by CpG potentiates clearance of cancer cells and overcomes tumor-expressed CD47-mediated ‘don’t-eat-me’ signal. Nature Immunology, 20(3), 265–275. https://doi.org/10.1038/s41590-018-0292-y
Matsuda, N., Wang, X., Lim, B., Krishnamurthy, S., Alvarez, R. H., Willey, J. S., Parker, C. A., Song, J., Shen, Y., Hu, J., Wu, W., Li, N., Babiera, G. V., Murray, J. L., Arun, B. K., Brewster, A. M., Reuben, J. M., Stauder, M. C., Barnett, C. M., … Ueno, N. T. (2018). Safety and efficacy of panitumumab plus neoadjuvant chemotherapy in patients with primary HER2-negative inflammatory breast cancer. JAMA Oncology, 4(9), 1207–1213. https://doi.org/10.1001/jamaoncol.2018.1436
Menta, A., Fouad, T. M., Lucci, A., Le-Petross, H., Stauder, M. C., Woodward, W. A., Ueno, N. T., & Lim, B. (2018). Inflammatory breast cancer: What to know about this unique, aggressive breast cancer. The Surgical Clinics of North America, 98(4), 787–800. https://doi.org/10.1016/j.suc.2018.03.009
Mezquita, L., Auclin, E., Ferrara, R., Charrier, M., Remon, J., Planchard, D., Ponce, S., Ares, L. P., Leroy, L., Audigier-Valette, C., Felip, E., Zerón-Medina, J., Garrido, P., Brosseau, S., Zalcman, G., Mazieres, J., Caramela, C., Lahmar, J., Adam, J., … Besse, B. (2018). Association of the lung immune prognostic index with immune checkpoint inhibitor outcomes in patients with advanced non-small cell lung cancer. JAMA Oncology, 4(3), 351–357. https://doi.org/10.1001/jamaoncol.2017.4771
Mighri, N., Mejri, N., Boujemaa, M., Berrazega, Y., Rachdi, H., El Benna, H., Labidi, S., Benna, F., Boubaker, S., Boussen, H., Abdelhak, S., & Hamdi, Y. (2022). Association between epidemiological and clinico-pathological features of breast cancer with prognosis, family history, Ki-67 proliferation index and survival in Tunisian breast cancer patients. PloS One, 17(9), e0269732. https://doi.org/10.1371/journal.pone.0269732
Munkácsy, G., Santarpia, L., & Győrffy, B. (2023). Therapeutic potential of tumor metabolic reprogramming in triple-negative breast cancer. Int J Mol Sci, 24(8), 6945. https://doi.org/10.3390/ijms24086945
Ogiwara, Y., Nakagawa, M., Nakatani, F., Uemura, Y., Zhang, R., & Kudo-Saito, C. (2022). Blocking FSTL1 boosts NK immunity in treatment of osteosarcoma. Cancer Lett, 537, 215690. https://doi.org/10.1016/j.canlet.2022.215690
Palevski, D., Levin-Kotler, L. P., Kain, D., Naftali-Shani, N., Landa, N., Ben-Mordechai, T., Konfino, T., Holbova, R., Molotski, N., Rosin-Arbesfeld, R., Lang, R. A., & Leor, J. (2017). Loss of macrophage Wnt secretion improves remodeling and function after myocardial infarction in mice. Journal of the American Heart Association. https://doi.org/10.1161/jaha.116.004387
Panossian, A., Seo, E. J., & Efferth, T. (2019). Effects of anti-inflammatory and adaptogenic herbal extracts on gene expression of eicosanoids signaling pathways in isolated brain cells. Phytomedicine: International Journal of Phytotherapy and Phytopharmacology, 60, 152881. https://doi.org/10.1016/j.phymed.2019.152881
Paparodis, R., Imam, S., Todorova-Koteva, K., Staii, A., & Jaume, J. C. (2014). Hashimoto’s thyroiditis pathology and risk for thyroid cancer. Thyroid: Official Journal of the American Thyroid Association, 24(7), 1107–1114. https://doi.org/10.1089/thy.2013.0588
Popović, M., Silovski, T., Križić, M., & DedićPlavetić, N. (2023). HER2 low breast cancer: A new subtype or a trojan for cytotoxic drug delivery? International Journal of Molecular Science, 24(9), 8206. https://doi.org/10.3390/ijms24098206
Ritchie, M. E., Phipson, B., Wu, D., Hu, Y., Law, C. W., Shi, W., & Smyth, G. K. (2015). limma powers differential expression analyses for RNA-sequencing and microarray studies. Nucleic Acids Research, 43(7), e47. https://doi.org/10.1093/nar/gkv007
Rodriguez-Aguayo, C., Bayraktar, E., Ivan, C., Aslan, B., Mai, J., He, G., Mangala, L. S., Jiang, D., Nagaraja, A. S., Ozpolat, B., Chavez-Reyes, A., Ferrari, M., Mitra, R., Siddik, Z. H., Shen, H., Yang, X., Sood, A. K., & Lopez-Berestein, G. (2019). PTGER3 induces ovary tumorigenesis and confers resistance to cisplatin therapy through up-regulation Ras-MAPK/Erk-ETS1-ELK1/CFTR1 axis. eBioMedicine, 40, 290–304. https://doi.org/10.1016/j.ebiom.2018.11.045
Rodriguez-Aguayo, C., Bayraktar, E., Ivan, C., Aslan, B., Mai, J., He, G., Mangala, L. S., Jiang, D., Nagaraja, A. S., Ozpolat, B., Chavez-Reyes, A., Ferrari, M., Mitra, R., Siddik, Z. H., Shen, H., Yang, X., Sood, A. K., & Lopez-Berestein, G. (2022). Corrigendum to “PTGER3 induces ovary tumorigenesis and confers resistance to cisplatin therapy through up-regulation Ras-MAPK/Erk-ETS1-ELK1/CFTR1 axis” [EBioMedicine 40 (2019) 290–304]. EBioMedicine, 83, 104194. https://doi.org/10.1016/j.ebiom.2022.104194
Ruan, G. T., Xie, H. L., Zhang, H. Y., Zhang, Q., Deng, L., Wang, Z. W., Zhang, X., Ge, Y. Z., Hu, C. L., Tang, M., Song, M. M., Zhang, X. W., Liu, T., Li, X. R., Zhang, K. P., Yang, M., Gong, Y. Z., Chen, Y. B., Yu, K. Y., … Shi, H. P. (2022). Association of systemic inflammation and low performance status with reduced survival outcome in older adults with cancer. Clinical Nutrition (Edinburgh, Scotland), 41(10), 2284–2294. https://doi.org/10.1016/j.clnu.2022.08.025
Ruella, M., Klichinsky, M., Kenderian, S. S., Shestova, O., Ziober, A., Kraft, D. O., Feldman, M., Wasik, M. A., June, C. H., & Gill, S. (2017). Overcoming the immunosuppressive tumor microenvironment of Hodgkin lymphoma using chimeric antigen receptor T cells. Cancer Discovery, 7(10), 1154–1167. https://doi.org/10.1158/2159-8290.Cd-16-0850
Ruth, J. H., Gurrea-Rubio, M., Athukorala, K. S., Rasmussen, S. M., Weber, D. P., Randon, P. M., Gedert, R. J., Lind, M. E., Amin, M. A., Campbell, P. L., Tsou, P. S., Mao-Draayer, Y., Wu, Q., Lanigan, T. M., Keshamouni, V. G., Singer, N. G., Lin, F., & Fox, D. A. (2021). CD6 is a target for cancer immunotherapy. JCI Insight. https://doi.org/10.1172/jci.insight.145662
Sacco, K. A., Notarangelo, L. D., & Delmonte, O. M. (2022). When to suspect inborn errors of immunity in Epstein–Barr virus-related lymphoproliferative disorders. Clinical Microbiology and Infection: The Official Publication of the European Society of Clinical Microbiology and Infectious Diseases. https://doi.org/10.1016/j.cmi.2022.10.003
Sato, A., Rahman, N. I. A., Shimizu, A., & Ogita, H. (2021). Cell-to-cell contact-mediated regulation of tumor behavior in the tumor microenvironment. Cancer Science, 112(10), 4005–4012. https://doi.org/10.1111/cas.15114
Shields, C. W. T., Evans, M. A., Wang, L. L., Baugh, N., Iyer, S., Wu, D., Zhao, Z., Pusuluri, A., Ukidve, A., Pan, D. C., & Mitragotri, S. (2020). Cellular backpacks for macrophage immunotherapy. Science Advances, 6(18), eaaz6579. https://doi.org/10.1126/sciadv.aaz6579
Singhal, S., Bhojnagarwala, P. S., O’Brien, S., Moon, E. K., Garfall, A. L., Rao, A. S., Quatromoni, J. G., Stephen, T. L., Litzky, L., Deshpande, C., Feldman, M. D., Hancock, W. W., Conejo-Garcia, J. R., Albelda, S. M., & Eruslanov, E. B. (2016). Origin and role of a subset of tumor-associated neutrophils with antigen-presenting cell features in early-stage human lung cancer. Cancer Cell, 30(1), 120–135. https://doi.org/10.1016/j.ccell.2016.06.001
Subhan, M. A., Parveen, F., Shah, H., Yalamarty, S. S. K., Ataide, J. A., & Torchilin, V. P. (2023). Recent advances with precision medicine treatment for breast cancer including triple-negative sub-type. Cancers (Basel). https://doi.org/10.3390/cancers15082204
Tao, W., Chu, C., Zhou, W., Huang, Z., Zhai, K., Fang, X., Huang, Q., Zhang, A., Wang, X., Yu, X., Huang, H., Wu, Q., Sloan, A. E., Yu, J. S., Li, X., Stark, G. R., Rich, J. N., & Bao, S. (2020). Dual role of WISP1 in maintaining glioma stem cells and tumor-supportive macrophages in glioblastoma. Nature Communications, 11(1), 3015. https://doi.org/10.1038/s41467-020-16827-z
Wang, J., Li, X., Wu, H., Wang, H., Yao, L., Deng, Z., & Zhou, Y. (2019). EMP1 regulates cell proliferation, migration, and stemness in gliomas through PI3K-AKT signaling and CD44. Journal of Cellular Biochemistry, 120(10), 17142–17150. https://doi.org/10.1002/jcb.28974
Wang, J., Sun, C., Li, J., Jiang, H., Qiu, Y., & Gong, M. (2022a). Knockdown of ETV4 promotes autophagy-dependent apoptosis in GBM cells by reducing the transcriptional activation of EMP1. Oncology Letters, 23(2), 41. https://doi.org/10.3892/ol.2021.13159
Wang, M., Liu, T., Hu, X., Yin, A., Liu, J., & Wang, X. (2020b). EMP1 promotes the malignant progression of osteosarcoma through the IRX2/MMP9 axis. Panminerva Medica, 62(3), 150–154. https://doi.org/10.23736/S0031-0808.20.03913-0
Wang, N., Zhu, L., Wang, L., Shen, Z., & Huang, X. (2022b). Identification of SHCBP1 as a potential biomarker involving diagnosis, prognosis, and tumor immune microenvironment across multiple cancers. Computational and Structural Biotechnology Journal, 20, 3106–3119. https://doi.org/10.1016/j.csbj.2022.06.039
Wang, X., Wu, F., Deng, Y., Chai, J., Zhang, Y., He, G., & Li, X. (2021). Increased expression of PSME2 is associated with clear cell renal cell carcinoma invasion by regulating BNIP3-mediated autophagy. International Journal of Oncology. https://doi.org/10.3892/ijo.2021.5286
Wang, Y. W., Cheng, H. L., Ding, Y. R., Chou, L. H., & Chow, N. H. (2017). EMP1, EMP 2, and EMP3 as novel therapeutic targets in human cancer. Biochimica et Biophysica Acta Reviews on Cancer, 1868(1), 199–211. https://doi.org/10.1016/j.bbcan.2017.04.004
Wang, Y., Yan, K., Lin, J., Liu, Y., Wang, J., Li, X., Li, X., Hua, Z., Zheng, Z., Shi, J., Sun, S., & Bi, J. (2020). CD8+ T cell co-expressed genes correlate with clinical phenotype and microenvironments of urothelial cancer. Frontiers in Oncology, 10, 553399. https://doi.org/10.3389/fonc.2020.553399
Wellenstein, M. D., Coffelt, S. B., Duits, D. E. M., van Miltenburg, M. H., Slagter, M., de Rink, I., Henneman, L., Kas, S. M., Prekovic, S., Hau, C. S., Vrijland, K., Drenth, A. P., de Korte-Grimmerink, R., Schut, E., van der Heijden, I., Zwart, W., Wessels, L. F. A., Schumacher, T. N., Jonkers, J., & de Visser, K. E. (2019). Loss of p53 triggers WNT-dependent systemic inflammation to drive breast cancer metastasis. Nature, 572(7770), 538–542. https://doi.org/10.1038/s41586-019-1450-6
Wolf, Y., Bartok, O., Patkar, S., Eli, G. B., Cohen, S., Litchfield, K., Levy, R., Jiménez-Sánchez, A., Trabish, S., Lee, J. S., Karathia, H., Barnea, E., Day, C. P., Cinnamon, E., Stein, I., Solomon, A., Bitton, L., Pérez-Guijarro, E., Dubovik, T., … Samuels, Y. (2019). UVB-induced tumor heterogeneity diminishes immune response in melanoma. Cell, 179(1), 219-235.e221. https://doi.org/10.1016/j.cell.2019.08.032
Xu, L., Han, F., Zhu, L., Ding, W., Zhang, K., Kan, C., Hou, N., Li, Q., & Sun, X. (2023). Advances in understanding the role and mechanisms of tumor stem cells in HER2-positive breast cancer treatment resistance (review). International Journal of Oncology. https://doi.org/10.3892/ijo.2023.5496
Yakubenko, V. P., Cui, K., Ardell, C. L., Brown, K. E., West, X. Z., Gao, D., Stefl, S., Salomon, R. G., Podrez, E. A., & Byzova, T. V. (2018). Oxidative modifications of extracellular matrix promote the second wave of inflammation via β(2) integrins. Blood, 132(1), 78–88. https://doi.org/10.1182/blood-2017-10-810176
Ye, Z. (2022). Identification of T cell-related biomarkers for breast cancer based on weighted gene co-expression network analysis. Journal of Chemotherapy (Florence, Italy). https://doi.org/10.1080/1120009x.2022.2097431
Yu, G., Wang, L. G., Han, Y., & He, Q. Y. (2012). clusterProfiler: An R package for comparing biological themes among gene clusters. OMICS: A Journal of Integrative Biology, 16(5), 284–287. https://doi.org/10.1089/omi.2011.0118
Yu, S., Zhao, J., Wang, M., Cheng, G., Li, W., Tang, L., Yao, S., Pang, L., Yin, X., Jing, Y., & Cheng, H. (2022). The correlation between neutrophil-to-lymphocyte ratio, carcinoembryonic antigen, and carbohydrate antigen 153 levels with chemotherapy-related cognitive impairment in early-stage breast cancer patients. Frontiers in Medicine, 9, 945433. https://doi.org/10.3389/fmed.2022.945433
Zhang, H., Yu, X., Yang, J., He, G., Zhang, X., Wu, X., Shen, L., Zhou, Y., Cheng, X., Liu, X., & Zhu, Y. (2022). Comprehensive analysis of pyroptotic gene prognostic signatures associated with tumor immune microenvironment and genomic mutation in breast cancer. Frontiers in Immunology, 13, 933779. https://doi.org/10.3389/fimmu.2022.933779
Zhang, L., Borjini, N., Lun, Y., Parab, S., Enyindah-Asonye, G., Singh, R., Bell, B. A., Bonilha, V. L., Ivanov, A. I., Fox, D. A., Caspi, R. R., & Lin, F. (2022b). CDCP1 regulates retinal pigmented epithelial barrier integrity for the development of experimental autoimmune uveitis. JCI Insight. https://doi.org/10.1172/jci.insight.157038
Zhang, Y., Wester, L., He, J., Geiger, T., Moerkens, M., Siddappa, R., Helmijr, J. A., Timmermans, M. M., Look, M. P., van Deurzen, C. H. M., Martens, J. W. M., Pont, C., de Graauw, M., Danen, E. H. J., Berns, E., Meerman, J. H. N., Jansen, M., & van de Water, B. (2018). IGF1R signaling drives antiestrogen resistance through PAK2/PIX activation in luminal breast cancer. Oncogene, 37(14), 1869–1884. https://doi.org/10.1038/s41388-017-0027-9
Zhu, L., Zhou, X., Gu, M., Kim, J., Li, Y., Ko, C. J., Xie, X., Gao, T., Cheng, X., & Sun, S. C. (2022). Dapl1 controls NFATc2 activation to regulate CD8(+) T cell exhaustion and responses in chronic infection and cancer. Nature Cell Biology, 24(7), 1165–1176. https://doi.org/10.1038/s41556-022-00942-8
Acknowledgements
We thank Dr. Jing Li and Cheng Peng for their helpful suggestion and comments on the manuscript. We also thank the National Cancer Institute and the American Human Genome Institute for providing open data.
Funding
This work was supported by the National Natural Science Foundation of China (NSFC) fund (82273460 and 32260167), Applied Basic Research Foundation of Yunnan Province (Grant No. 202101AV070002), Major Science and Technology Projects in Yunnan Province (Grant No. 202102AA310055), A grant (Grant No. KLTIPT-2023-02) from Key Laboratory of Tumor Immunological Prevention and Treatment in Yunnan Province, Yan'an Hospital Affiliated to Kunming Medical University, Kunming and grants (Grant No. 2023Y0222, ZC-22223017 and ZC-22223104) from Yunnan University.
Author information
Weiyu Bai, Qinggang Hao, and Zhimeng Zhang contributed equally to this work.
Authors and Affiliations
Center for Life Sciences, School of Life Sciences, State Key Laboratory for Conservation and Utilization of Bio-Resources in Yunnan, Yunnan University, Kunming, China
Weiyu Bai, Qinggang Hao, Zhimeng Zhang, Bingxing Han, Huilin Xiao, Dong Chang, Junling Shen & Jianwei Sun
Department of Dermatology and Venereology, The First Affiliated Hospital of Kunming Medical University, Kunming, Yunnan, China
Yun Zhu
Contributions
WB, QH, ZZ, DC, BH and XY analyzed the data. JS, JS and YZ wrote the manuscript. The authors have read and approved the final manuscript.
Corresponding authors
Correspondence to Yun Zhu, Junling Shen or Jianwei Sun.
Ethics declarations
Conflict of interest
The authors declare that they have no conflict of interest.
Supplementary Information
Below is the link to the electronic supplementary material.
42764_2023_102_MOESM1_ESM.pdf
Supplementary file1 Supplementary Figure 1. Basic clinical data of breast cancer patients. (a). The survival curves of patients grouped by age. (b). The survival curves of patients with different tumor stages. (c). The survival curves for patients with different tumor depth (d). The survival curves of patients with different lymph node invasion stages. (e). The survival curve of patients with different distant metastasis stages. (PDF 312 KB)
42764_2023_102_MOESM2_ESM.pdf
Supplementary file2 Supplementary Figure 2. Risk scores increase in patients with tumor stages increase. (a). The risk scores of patients with different tumor stages. (b). The risk scores of patients with different tumor depth stages. (c). The risk scores of patients with different lymph node invasion stages. (d). The risk scores of patients with different distant metastasis stages. (PDF 666 KB)
42764_2023_102_MOESM3_ESM.pdf
Supplementary file3 Supplementary Figure 3. high-risk group present higher tumor mutation burden. (a). Waterfall plot of somatic mutation summary in the high-risk group. (b). Waterfall plot of somatic mutation summary in the low-risk group. (c). Protein domains and sites and types of amino acid mutations in PIK3CA in high-risk and low-risk groups. (d). Protein domains and sites and types of amino acid mutations in TP53 in high-risk and low-risk groups. (e). Protein domains and sites and types of amino acid mutations in TTN in high-risk and low-risk groups. (f). Protein domains and sites and types of amino acid mutations in MAP3K1 in high-risk and low-risk groups. (g). Protein domains and sites and types of amino acid mutations in GATA3 in high-risk and low-risk groups. (h). Protein domains and sites and types of amino acid mutations in CDH1 in high-risk and low-risk groups. (j). Functional enrichment for known oncogenic signaling pathways in the high-risk group. (k). Functional enrichment for known oncogenic signaling pathways in the low-risk group. (l). Drug-gene interaction and gene-drug availability information in the high-risk group. (m). Drug-gene interaction and gene-drug availability information in the low-risk group. (PDF 693 KB)
Supplementary file4 (PDF 77 KB)
Supplementary file5 (XLSX 26 KB)
Rights and permissions
Springer Nature or its licensor (e.g. a society or other partner) holds exclusive rights to this article under a publishing agreement with the author(s) or other rightsholder(s); author self-archiving of the accepted manuscript version of this article is solely governed by the terms of such publishing agreement and applicable law.
About this article
Cite this article
Bai, W., Hao, Q., Zhang, Z. et al. Identification of a novel inflammation-related gene signature for predicting inflammatory breast cancer survival. GENOME INSTAB. DIS. 4, 154–175 (2023). https://doi.org/10.1007/s42764-023-00102-8
Received28 April 2023
Revised27 May 2023
Accepted02 June 2023
Published13 June 2023
Issue DateJune 2023
DOIhttps://doi.org/10.1007/s42764-023-00102-8
Share this article
Anyone you share the following link with will be able to read this content:
Get shareable linkKeywords
Breast cancer
Inflammation
Gene signature
Drug resistance
TMB
用户登录
还没有账号?
立即注册